

INTRODUCTION
Total knee arthroplasty (TKA) involves replacing the knee joint with a prosthesis, usually in patients with knee osteoarthritis. Its main goals are to restore normal joint function and alleviate pain.1
Although the number of knee arthroplasties performed is increasing, around 20% of uncomplicated TKA patients remain dissatisfied, a relatively high figure compared to similar interventions like hip arthroplasty.2,3
Multiple factors have been described that could explain this dissatisfaction rate, including patient-related factors (age and outcome expectations), residual pain, residual limitation of knee function and range of motion, and surgical technique. Achieving good long-term clinical and functional outcomes in TKA depends on various factors, with proper implant alignment and balanced soft tissues being notable among them.4
Various methods for aligning the prosthesis with respect to the knee’s mechanical axis were developed when the technique was first introduced. Among them, the mechanical alignment (MA) technique was founded on the theory that aligning the knee to neutral, with a hip-knee-ankle (HKA) angle within 3 degrees of neutral in the coronal plane would ensure longer prosthetic material durability, as it would distribute the load equally across both knee compartments.5
Although MA remains the most popular technique for implanting TKA, in the pursuit of reducing the percentage of dissatisfied patients and considering that MA may alter the native knee anatomy, laxity, and kinematics, new alignment methods have been developed.6
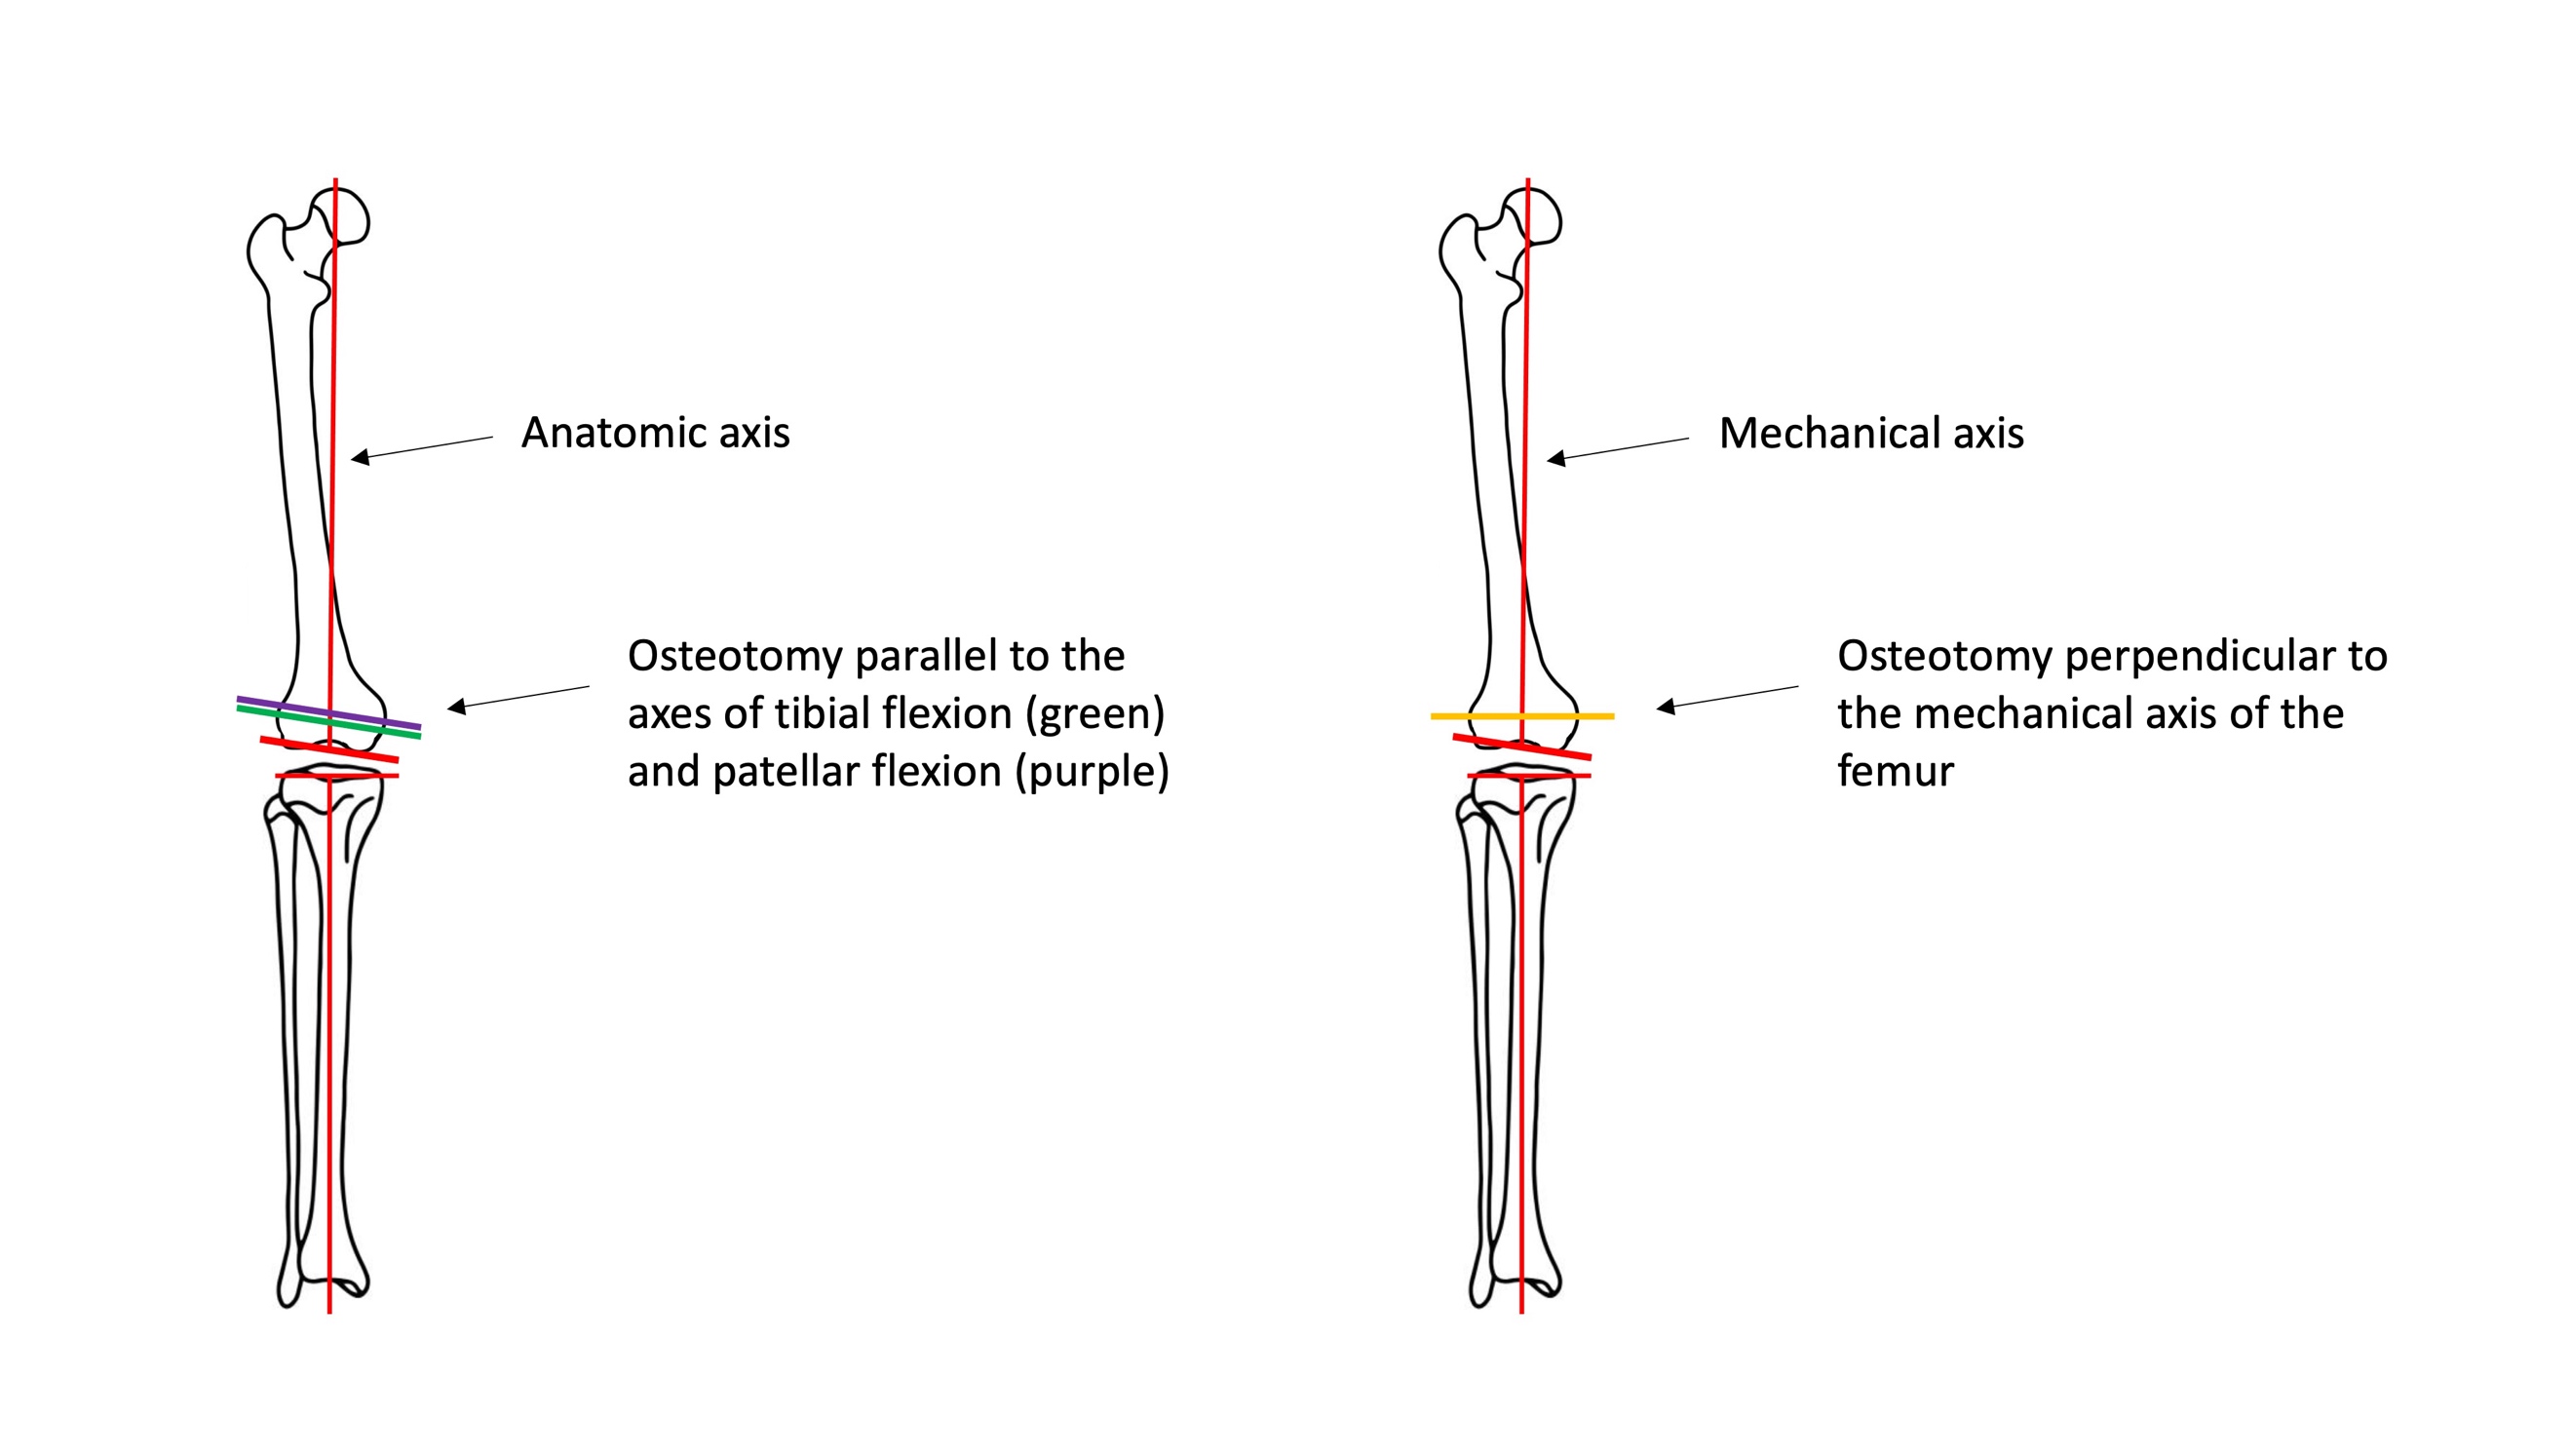
MECHANICAL ALIGNMENT
MA (Figure 1) aims to align the femur and tibia components perpendicular to their mechanical axes, modifying internal and external rotation angles of the components to establish parallel extension-flexion gaps for prosthetic knee placement and releasing the medial or lateral collateral ligaments as needed to restore medial and lateral tension balance in the knee.7 This implant positioning was designed to attempt to achieve even distribution of loads between tibial compartments to avoid accelerated polyethylene wear and premature implant loosening.8
_and_mechanical_axis_(right).jpeg)
As the first developed method, it has a series of advantages: familiarity with the technique, long-term known outcomes, and equitable load distribution. Additionally, commonly used implants are designed for this type of alignment. Nonetheless, limitations have prompted the development of alternative techniques. Firstly, it oversimplifies knee biomechanics, focusing solely on alignment around the mechanical axis. Secondly, challenges may arise in achieving joint space balance throughout flexion and extension. Thirdly, establishing a mechanical axis may lead to soft tissue imbalance, needing tendon and ligament modifications through release or tension increase.7 Fourthly, insufficient resection of the lateral femoral condyle occurs when intervening in varus knees, altering patellar biomechanics and causing flexion overload. Thus, there is a hypothesis that patellar instability influences patient dissatisfaction.8
ADJUSTED MECHANICAL ALIGNMENT
One of the developed techniques involves modifying mechanical alignment for patients with severe coronal plane deformities. The tibial component is aligned mechanically, while the femoral component allows a slight constitutional deformity (maximum of 3°) preservation.8,9
ANATOMIC ALIGNMENT
Anatomic alignment (AA) (Figure 1) was introduced in the 1980s by Hungerford and Krackow.10 It seeks systematic attainment of an oblique joint line, 2-3° valgus relative to the mechanical axis of the limb. With its implementation, prostheses have been developed with a 3° obliquity included in the design, with the surgical procedure being similar to MA.8
KINEMATIC ALIGNMENT
Kinematic alignment (KA) aims to restore the natural joint by preforming a true knee resurfacing. Consequently, femoral and tibial implants are aligned on the knee’s three kinematic axes.11,12
To achieve accurate restoration of the native joint line, precise resection is essential. Several techniques are utilized for this purpose, such as conventional calipered measurements,13 patient-specific instrumentation (PSI),14 computer navigation,15 and robotic-assisted surgery.16 Advocates of KA argue that this approach can enhance pain relief, functionality, and patient satisfaction by reducing gap imbalances and eliminating the necessity for soft tissue release.17,18
In the Figure 2 we compare the femoral osteotomy in kinematic alignment and mechanical alignment.

RESTRICTIVE KINEMATIC ALIGNMENT
Restrictive kinematic alignment (RKA) involves applying KA while maintaining the outcome within a “precaution zone”, before it is clearly known which alignment boundaries are safe.8,20 In rare cases where the deformity extends beyond the precaution zone, corrective osteotomies are performed to subsequently align the prosthesis kinematically.8
FUNCTIONAL ALIGNMENT
Functional alignment (FA) was developed to reduce lateral compartment laxity and attain stability throughout the range of motion.21 It aims to position components to minimize compromise to the soft-tissue envelope, thus restoring the joint’s plane and obliquity as dictated by the soft tissues. Virtual gap balancing can be initiated either from a MA or a KA starting point.9,22 However, starting from a MA point requires greater external rotation of the femoral component to balance the medial flexion-to-extension gap, resulting in a more neutral Joint Line Obliquity (JLO). Conversely, starting from a KA point is more likely to minimize lengthening of the lateral joint line, maintain the stability of the medial collateral ligament to support any medial pivoting, and restore the native JLO.22–24
CLINICAL OUTCOME ASSESSMENT
To objectively assess clinical outcomes after surgery, collected articles used various evaluation scales or Patient-Reported Outcome Measures (PROMs):
-
Western Ontario and McMaster Universities Osteoarthritis Index (WOMAC).25
-
Knee Society Score, which comprises two parts: Knee Society Score original (KSS) and Knee Society Score functional (KFS). Combined Knee Society Score (CKSS) sums both scores.26
-
Oxford Knee Score (OKS).27
-
Range of motion (ROM), equivalent to the flexion angle’s range.28
-
The Forgotten Joint Score (FJS): The score is based on patients forgetting about the replaced joint in daily life.29
-
The Knee Injury and Osteoarthritis Outcome Score (KOOS).30
RADIOLOGICAL OUTCOME ASSESSMENT
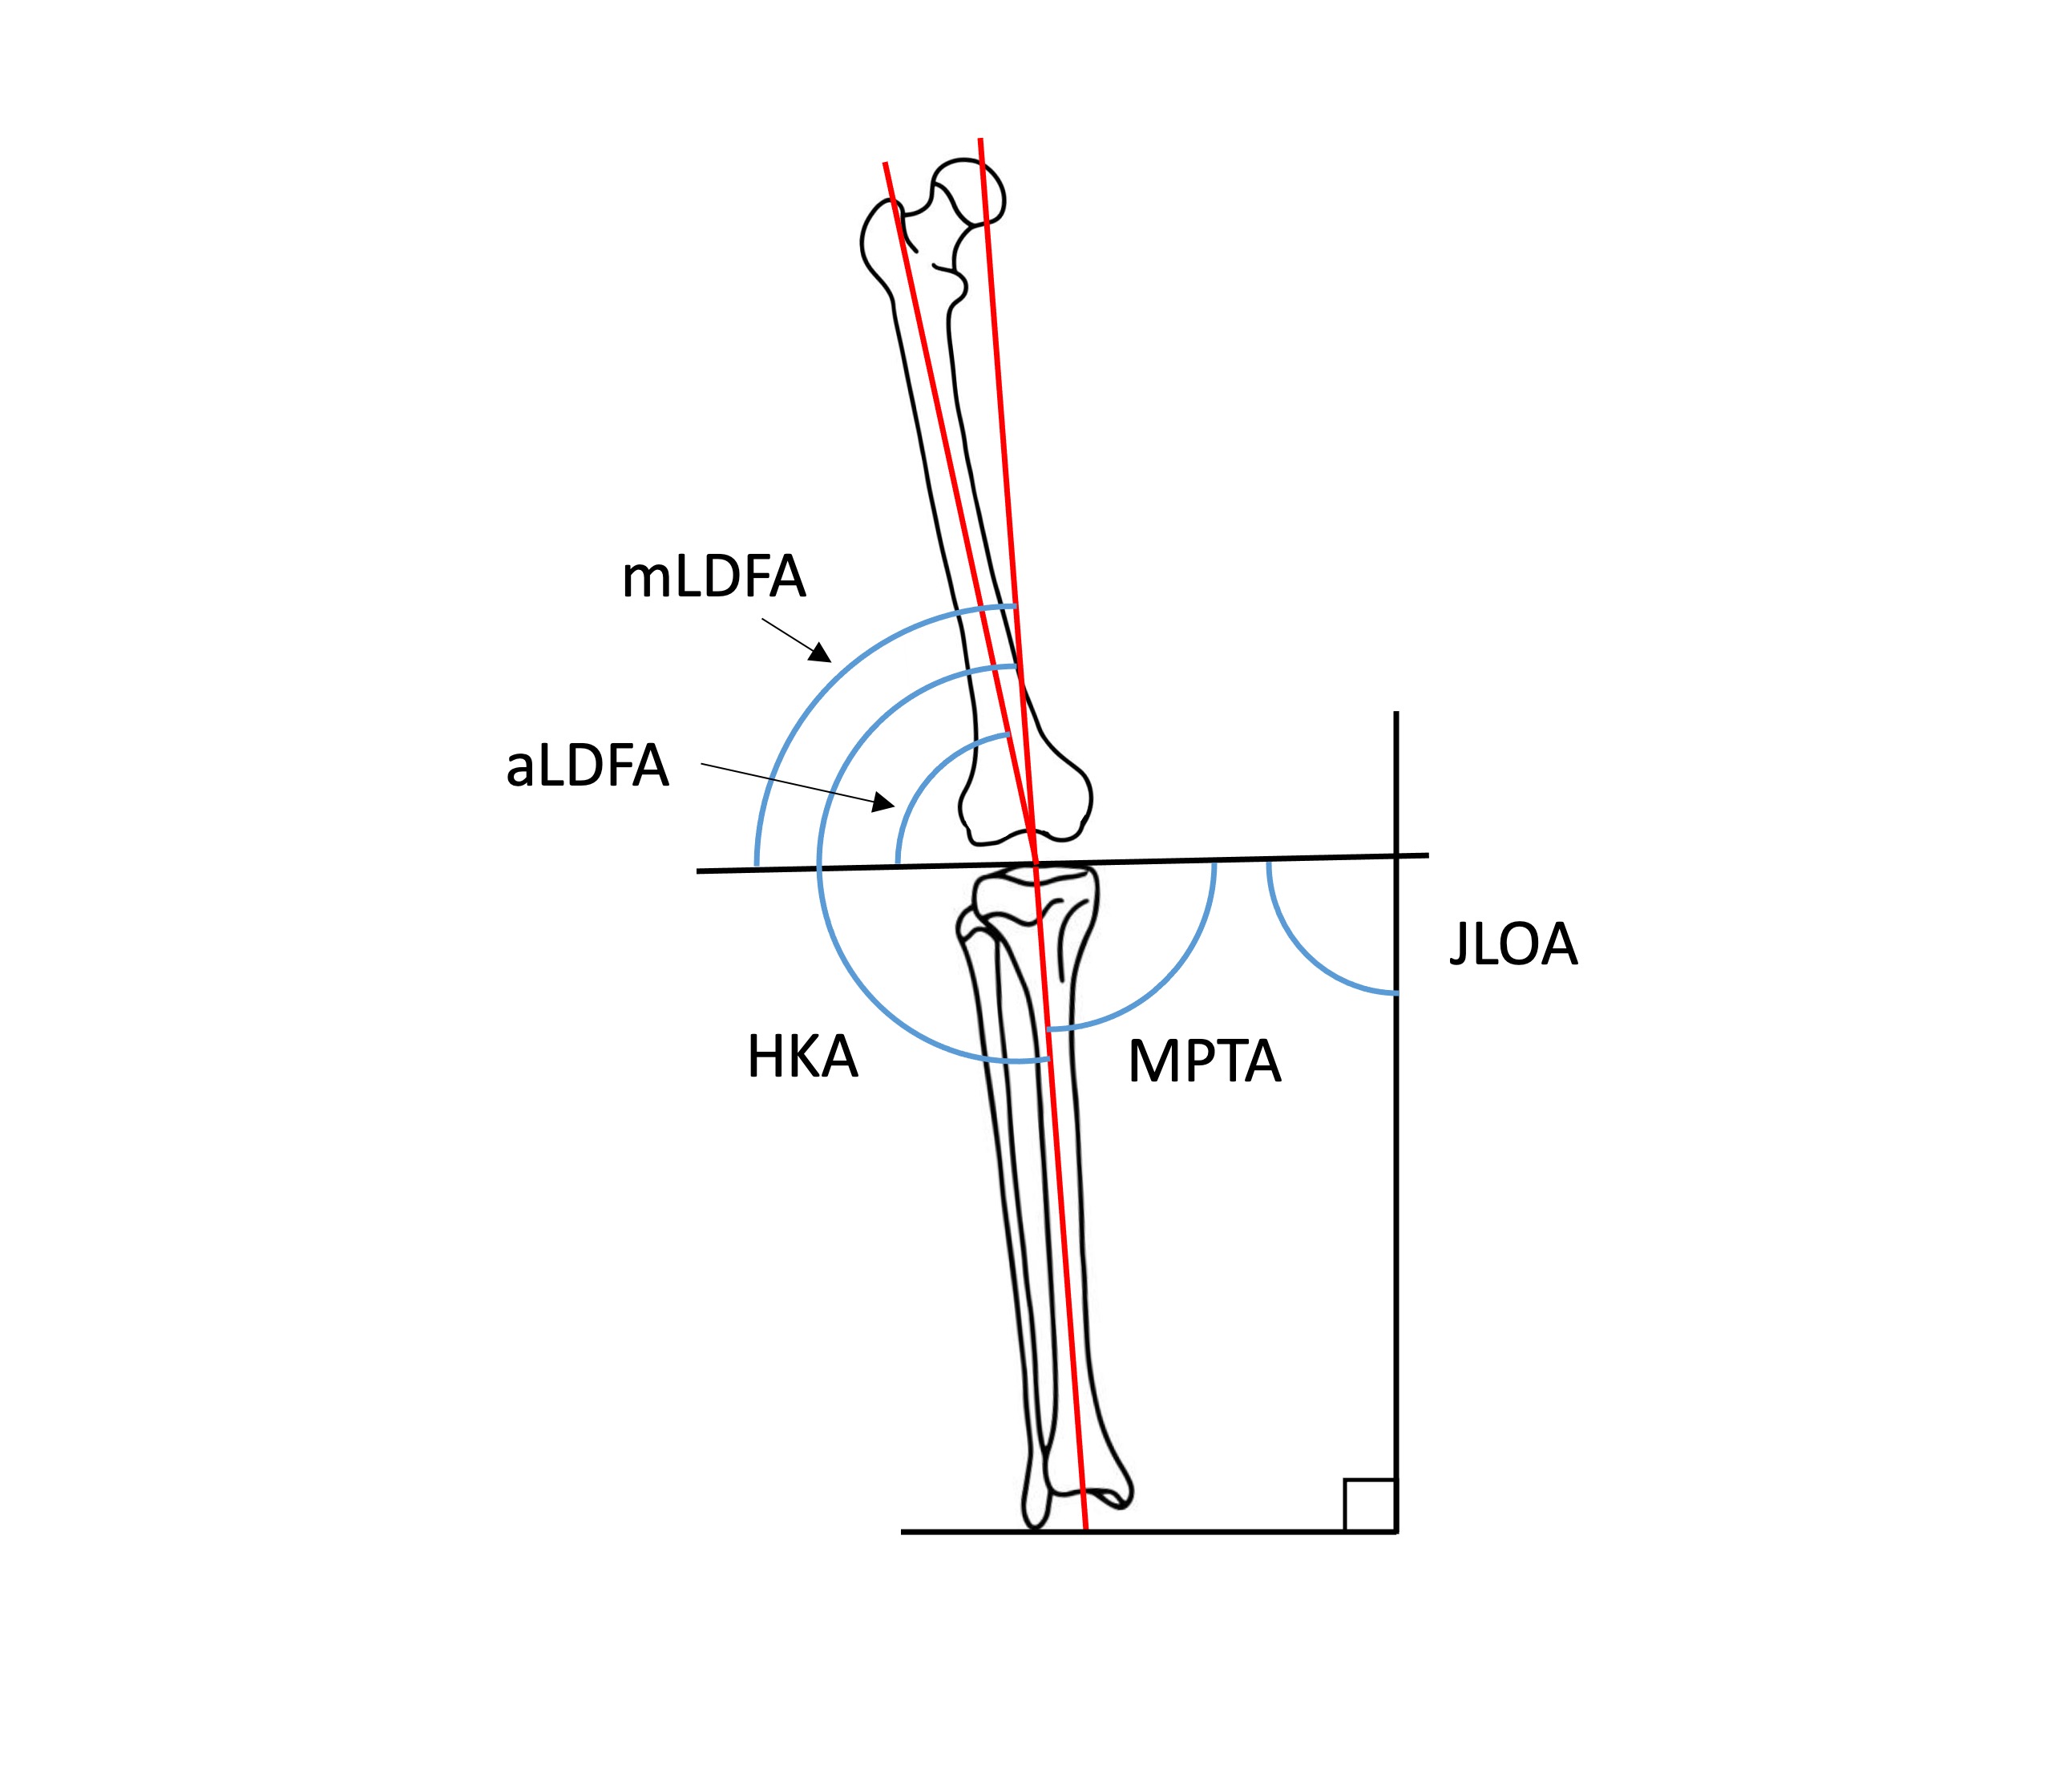
Radiological results were collected through imaging tests such as plain radiography, computed tomography, and magnetic resonance imaging to determine deviations from different limb axes and differences between alignment methods. In the coronal plane (Figure 3)31: Hip-Knee-Ankle angle (HKA), Mechanical Lateral Distal Femoral Angle (mLDFA), Anatomic Lateral Distal Femoral Angle (aLDFA), Medial Proximal Tibial Angle (MPTA) and Joint Line Obliquity Angle (JLOA). In the sagittal plane: Tibial Slope (TS).32 Additionally, some articles reported femoral rotation: rotation of the femoral component relative to the epicondylar axis (negative values indicate internal rotation).

JUSTIFICATION
Despite the existence of meta-analyses and systematic reviews comparing KA and MA, no superiority of one technique over the other has been established. Therefore, a systematic review of the current literature was conducted, focusing on recent outcomes without limiting the search to KA and MA exclusively. The PICO (Patient, Intervention, Comparator, and Outcome) strategy was applied to conduct the review.
P: Patients requiring TKA.
I: TKA using alignment methods other than MA.
C: TKA aligned mechanically (the current technique of choice).
O: Clinical outcomes.
OBJECTIVES
Considering the advantages and disadvantages of each technique, the following objectives were investigated:
-
Comparing implant lifespan between MA and other methods.
-
Comparing the percentage of dissatisfied patients between MA and other methods.
-
Comparing the stability of operated knees, including patellar stability.
-
Comparing radiological results of operated knees.
-
Whether any alignment method demonstrates sufficient superiority and safety to be considered better than the most common method (MA).
METHODS
We performed a systematic literature search in keeping with the Preferred Reporting Items for Systematic reviews and Meta-Analyses (PRISMA) guidelines. The following combination of thesauri and boolean operators was applied in Pubmed and Cochrane databases, being the final search on the 20th of March 2023: ((((kinematic alignment) OR (mechanical alignment)) OR (functional alignment)) OR (anatomic alignment)) AND (total knee arthroplasty), with the terms present in the article titles. No additional filters were applied to the search. This yielded 226 articles.
Two authors screened the abstracts in order to include articles that matched inclusion and exclusion criteria. Eligibility criteria included articles that provided comparative data between different alignment methods and reported clinical and/or radiological outcomes. Exclusion criteria were duplicates, unpublished results, studies limited to the description of surgical techniques, studies whose results were solely due to robotics, navigation or different brand of implants, cadaver studies, virtually performed surgery studies, letters, and articles whose full text was not written in English or Spanish. Furthermore, meta-analyses and systematic review were excluded to avoid data duplication.
From the primary search in Pubmed, 103 entries were obtained, while from Cochrane, 123 entries were collected, originating from: Embase (n = 53), Pubmed (n = 48), International Clinical Trials Registry Platform (ICTRP, n = 26), National Institute of Health (NIH, n = 19), and CINAHL (n = 2). After applying the inclusion and exclusion criteria and eliminating the duplicated articles, we obtained 23 studies. Additional records identified from meta-analyses were included (n=4), resulting in a total of 27 articles. The article selection strategy is illustrated in the flowchart from Figure 4.

RESULTS
The results are summarized in the Tables I, II, III, IV, V, VI and VII, which include:
-
Demographic data.
-
Functional assessment scale outcomes.
-
Radiological outcomes.
In response to the objectives set at the beginning of the review, the first objective was to assess whether MA improves implants lifespan compared to KA. Articles reviewing patients over extended follow-up periods (Seon et al. 2017, Yeo et al. 2019, and Young et al. 2020, with follow-up times of 8, 8, and 5 years respectively) did not find statistically significant differences in terms of early prosthetic loosening.39,42,44 Furthermore, Laende et al. specifically measured prosthetic component wear two years after the intervention and found no significant differences between patient groups operated on with both methods.41
Regarding patient satisfaction, there were inconclusive results, as reflected in Tables III and IV. However, all articles that found significant differences in functional assessment scales favoured KA or FA over MA, leading to increased satisfaction.
Another theoretical advantage of KA was achieving earlier recovery by respecting the patient’s constitutional biomechanics. Some articles attempted to objectively measure this improvement in recovery speed by calculating the distance patients walked on the hospital floor before discharge. One article found no statistically significant differences between alignment methods,33 but it’s worth noting that two other articles indicated a greater distance walked by kinematically aligned patients.35,53
Another objective was to assess postoperative joint stability (Table V), for which no differences were found between the two groups (MA and KA) in the number of patients reporting instability after surgery9,14,35,38,42,49,54 despite several articles noting that ligament and tendon release was more pronounced in MA than in KA.18,40,41,43 Additionally, three articles reported cases of patellar instability: Two cases were reported by Dossett et al., one in the MA group and one in the KA group; Young et al. also reported one case in each group, and Abhari et al. reported only one case in the MA group. Therefore, no differences in patellofemoral stability can be concluded.33,40,49 Regarding other alignment methods, McEwen at al. found statistically significant differences in lateral extension gap (LEG) in favor of FA.43 In Winnock de Grave et al.'s 2022 study, which compared adjusted mechanical alignment with inverted kinematic alignment (iKA), no soft tissue release was required for any of the patients.9 In Yim et al.'s 2013 study, comparing AA and MA, no results of tendon releases were reported, but postoperative joint laxity was measured, with no differences between the two methods.34
Regarding radiological results, as seen in Tables VI and VII, different alignment methods lead to differences in coronal plane knee angles but not in the sagittal plane (except for the Young et al. 2017 study). All studies met a mean mLDFA > 82° and a mean MTPA > 87°, so the resulting mean alignment from all alignment methods in all studies falls within the “precaution zone”, outside of which early prosthetic component wear is usually observed.56,57
In the two trials comparing AA with MA, radiological results differed between the two methods, but no improvements in functional outcomes were observed for either method.34,42
One study comparing FA with MA showed, in addition to radiological differences, improvements in WOMAC, FJS, and the functional part of the KSS questionnaire in the FA group. However, no differences were found in the KSS questionnaire part related to pain and stability.52
Another article that used the iKA showed radiological differences, but in terms of satisfaction and functional results, superiority of inverted kinematic alignment was demonstrated only in patients with varus deformity (HKA <177°) after multivariate analysis.9
The study comparing RKA with MA showed better functional results for RKA in the WOMAC, KSS, and FJS questionnaires, with no differences in range of motion.49
Ultimately, no significant differences in postoperative complication rates were found among the analysed methods.
DISCUSSION
Regarding implants lifespan, the results observed in this review do not support the theoretical advantage of MA. Therefore, this finding provides reassurance when applying KA, as it was one of the main concerns raised. The maximum follow-up period recorded in the articles of this review is eight years, so future studies with longer follow-up periods are necessary to fully support the idea that component wear is not greater in KA than in MA. However, in this review, this equality of results is observed in terms of prosthetic wear-related consultations. The article that quantitatively measured polyethylene wear did so after two years of follow-up,41 so the evidence provided in this review regarding the equality of component wear between KA and MA is limited, and more long-term quantitative results are needed to confirm it. Moreover, all studies met a mean mLDFA > 82° and a mean MTPA > 87°. These results explain the lack of differences in terms of early prosthetic loosening since other studies defined an increased loosening rate with a tibial varus deviation of more than 3°56 and a femoral valgus deviation of more than 8°.57
Furthermore, the main finding of this review is that, despite conflicting results, there is a trend towards better clinical outcomes in patients with kinematically aligned knee prostheses compared to those using the traditional MA approach, with no differences in complication rates observed. Other reviews and meta-analyses support this finding.58–66 It should be noted that errors have been identified in Liu’s meta-analysis regarding the data from HKA and TS from Yeo et al. 2019, where MA data were mistakenly assigned to AA and vice versa,63 upon comparison with the original article.42
In terms of knee stability, some authors argue that the reduced ligament release in KA leads to less inflammation and faster recovery.18,35 However, inconclusive results are found in the articles included in the review.
Regarding functional alignment, McEwen’s clinical trial found differences in terms of radiological outcomes compared to the MA. Additionally, differences in terms of LEG are described in the stability assessment.43 Choi et al.'s article demonstrates slight functional advantages in FA application. However, the FA group underwent robotic surgery, while the MA group underwent conventional surgery.52 Therefore, in future clinical trials, comparing FA with MA should be conducted under similar intervention conditions to appreciate the potential improvements offered by alignment type and robotic approach separately. In this context, MacDessi et al. propose a protocol for future clinical trials to compare two alignment methods and conventional surgery versus robotic surgery in a factorial manner, allowing the interpretation of alignment method and robotic results independently.67
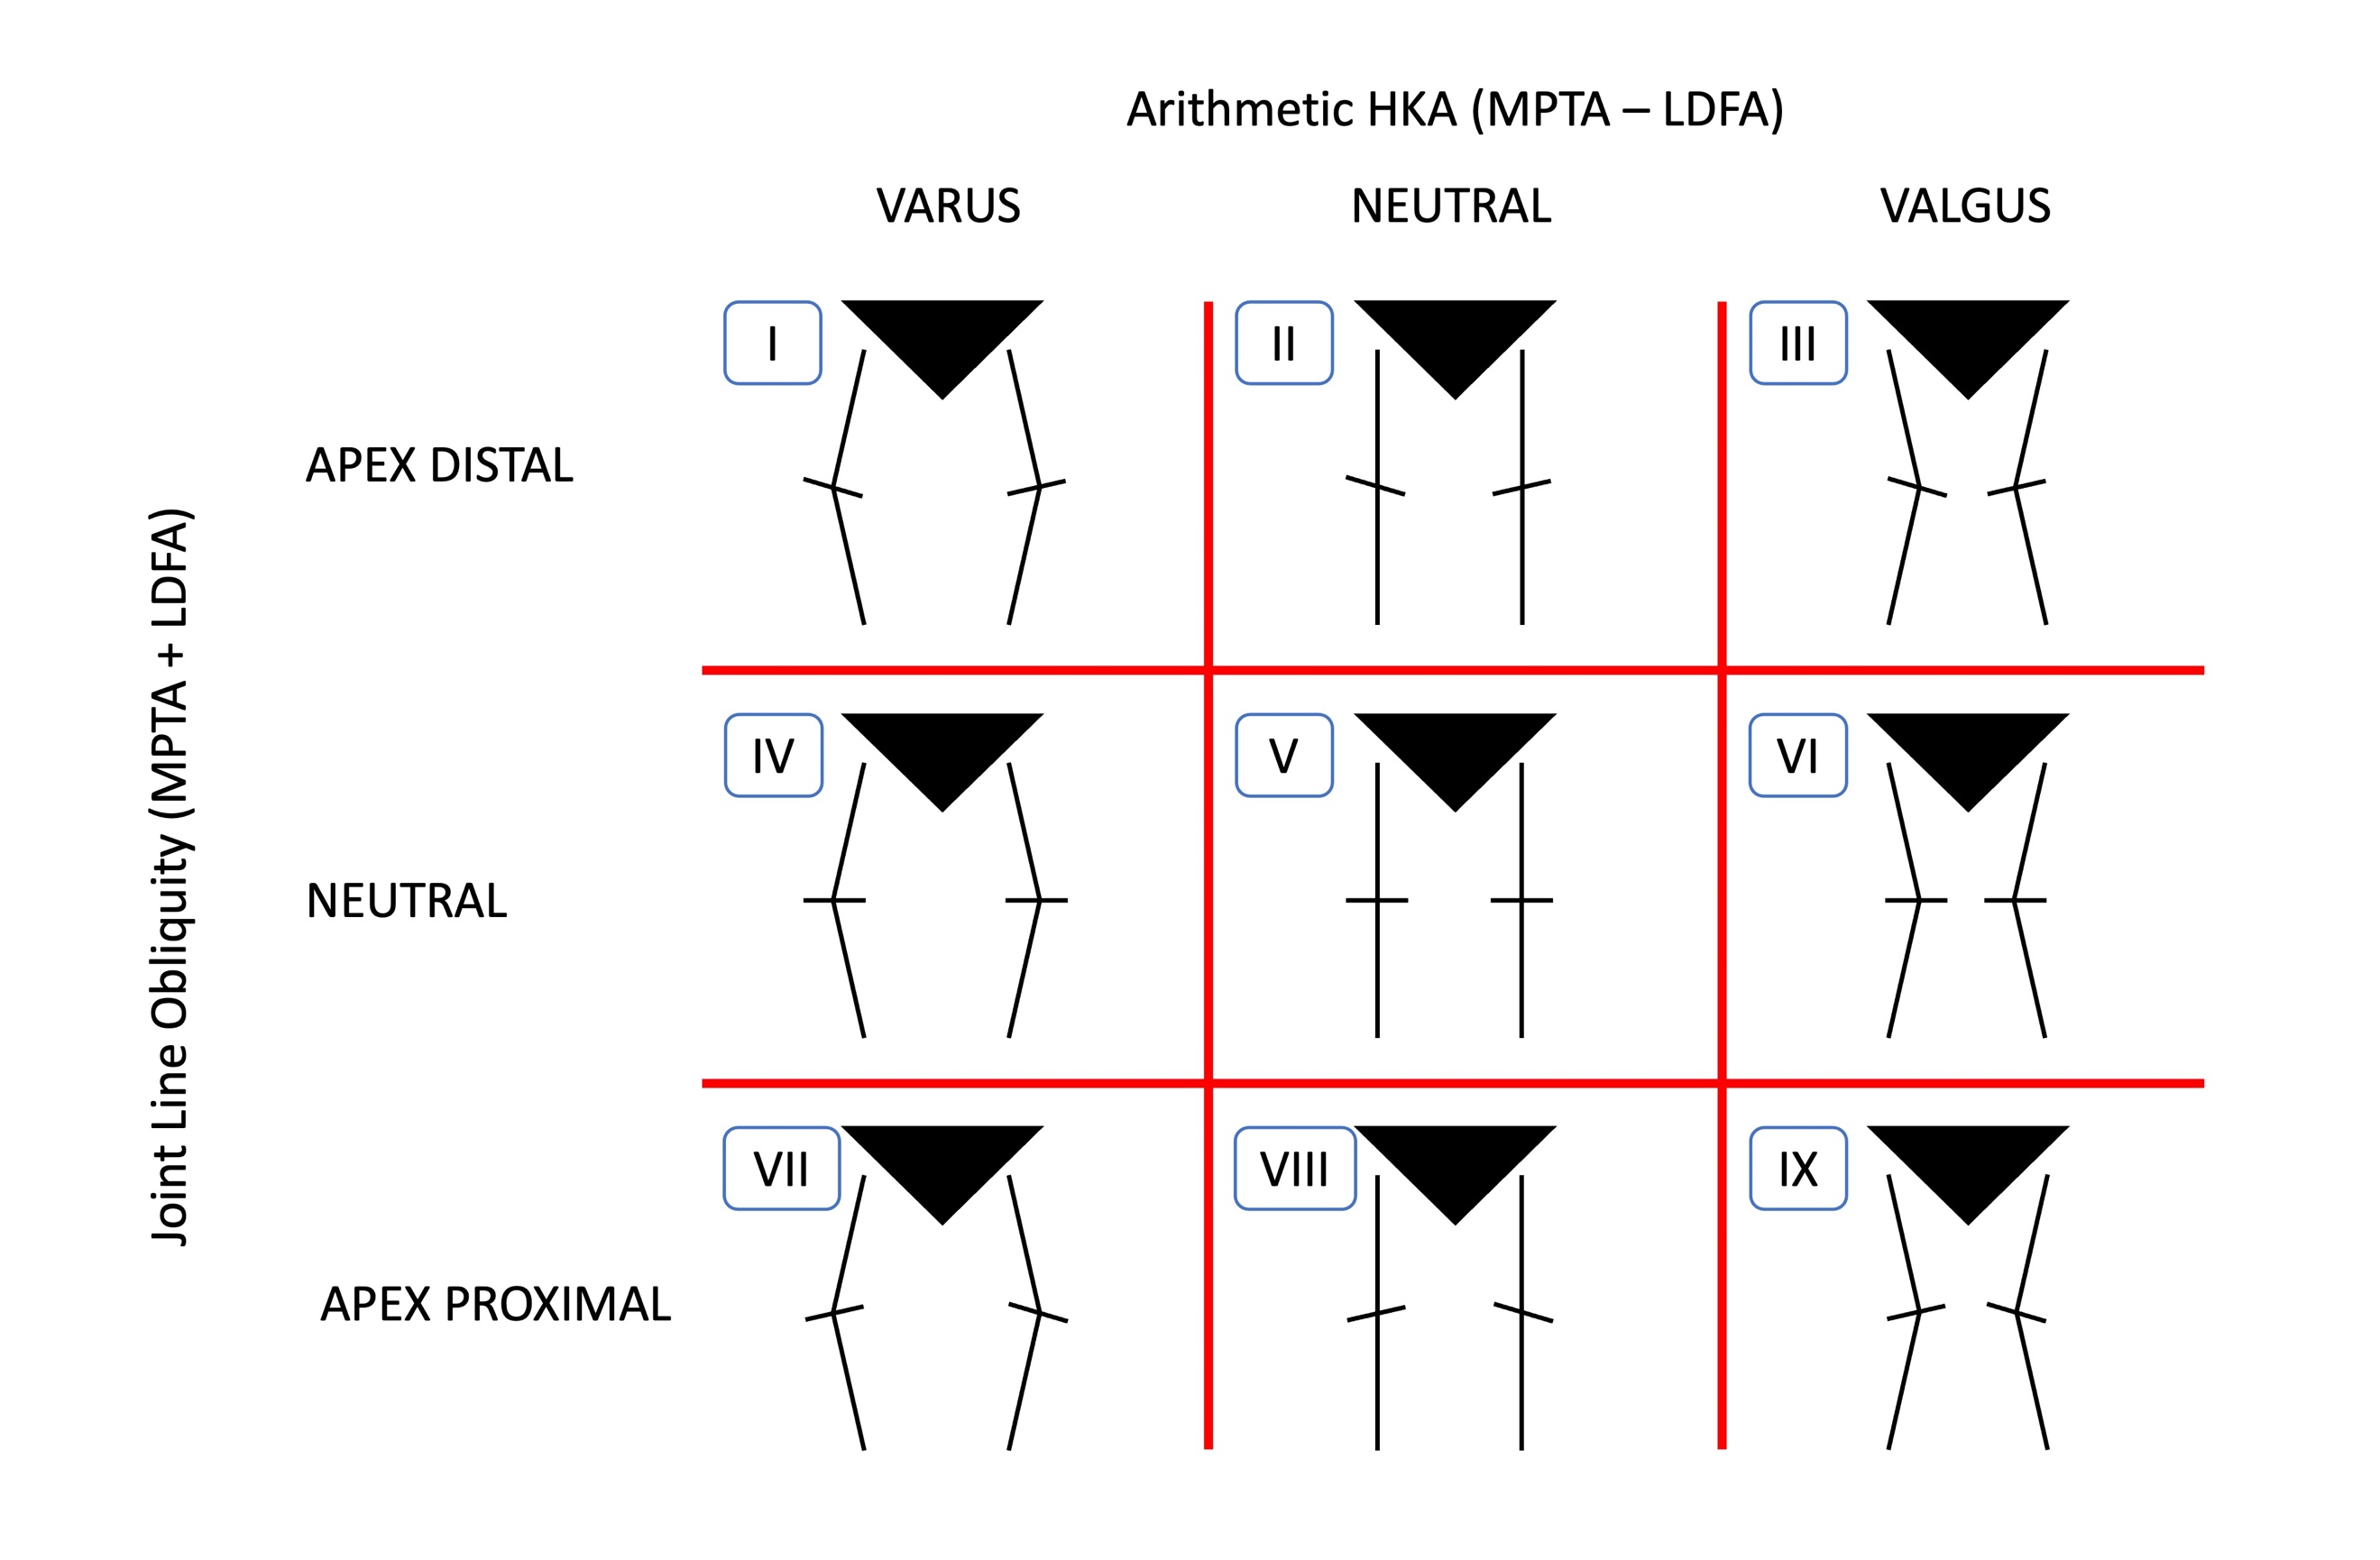
Another important point introduced by Choi et al.'s article is the assessment of patient knee phenotypes. In 2019, Hirschmann et al. described a new classification of knee joint phenotypes, as the conventional classification into varus, neutral, or valgus only considers limb deviation from the frontal plane without accounting for the orientation of the joint line to the ground, which also influences knee and limb mechanics. In addition to considering the angle relative to the mechanical axis (HKA), they consider angles between the femoral axis and the joint line (mLDFA) and between the tibial axis and the joint line (MPTA, also occasionally abbreviated as TMA). In the case of Hirschmann et al., the medial version of mLDFA (Femoral Mechanical Angle, FMA) is used instead of mLDFA.68 As a reference value, RKA considers HKA values of 180° ± 3°, mLDFA 90° ± 5°, and MPTA 90 ± 5° as falling within the “precaution zone”, which are considered neutral values. Any deviation greater than this is considered valgus or varus (although the limits of neutrality vary among authors and there is no definitive consensus). In this way, 27 different phenotypes are described, depending on the combinations of HKA, FMA, and TMA, with all three angles being varus, neutral, or valgus. In summary, 9 phenotypes are considered, considering only limb deviation from the mechanical axis (HKA) and the angle of the joint line relative to the ground (JLOA).69 (Figure 5)

In the ongoing pursuit of personalized medicine, it is foreseeable that adapting alignment methods to each patient’s characteristics will be implemented if it proves superior to conventional methods. For example, KA could be advantageous in phenotypes I, II, IV, and V, which are varus or neutral deviations supported by clinical trials with KA; RKA could be suitable for phenotypes III and VI, as valgus deviations often lead to exclusion criteria in KA trials,38,42,43,45,49,51,55 going beyond the previously mentioned “precaution zone”; and MA might be indicated for phenotypes VII, VIII, and IX, which are less common in the population and involve more extreme deformities.69
Although recent articles report results based on phenotypes,70 future trials should be designed to compare alignment method results and phenotypes separately, like the previously mentioned MacDessi et al. protocol.67
In addition to the brief follow-up period to determine potential long-term prosthetic wear, another major limitation of this review is the heterogeneity in KA techniques, as some studies use patient-specific instruments, others use conventional methods, and some employ robotic surgery. This limitation is shared with other reviews and meta-analyses.58,59
In conclusion, regarding the comparison of the most used alignment methods, mechanical and kinematic, while not all studies observe functional or patient satisfaction differences, those that do find such differences favor KA. It should be emphasized that these differences have been observed under clinical trial conditions with rigorous inclusion and exclusion criteria. As noted earlier, valgus deformity was an exclusion criterion in 7 articles,38,42,43,45,49,51,55 but patients with deviations of more than 10° in the coronal plane, BMI greater than 40 kg/m2, or prior knee surgeries were also frequently excluded.
It would be interesting to conduct studies with more relaxed inclusion and exclusion criteria, more closely resembling routine surgical practice, and with a longer follow-up period, to fully confirm the advantage of KA in terms of functional outcomes. Furthermore, presenting results based on patients’ knee phenotypes could help determine whether one alignment method is superior for a specific knee phenotype.
CONCLUSION
-
No greater wear or early loosening of components in kinematically aligned prostheses was observed two years post-surgery compared to mechanically aligned prostheses. To objectively assess component wear equality between both methods, studies analyzing quantitative prosthesis thickness over a longer time period are needed.
-
KA is superior in certain cases in terms of patient functionality and reduced pain, but it does not seem sufficient to explain the 20% of patients dissatisfied after TKA.
-
Despite greater ligament and tendon release in MA, this does not translate into differences in consultations for femorotibial or femoropatellar instability following surgical intervention.
-
Although KA shows superiority in functional and patient satisfaction results in several included studies, it must be considered that study conditions do not accurately mirror real-world surgical conditions. Further studies are necessary to ascertain the reproducibility of the promising clinical outcomes documented by these articles.
CONTRIBUTIONS
Juan Segura-Nuez: main and corresponding author, study design, introduction, literature search, acquisition and analysis of abstracts, result analysis, writing, table design, discussion.
Carlos Martín-Hernández: introduction, study design, literature search, final decision in disagreement, writing, discussion.
Julián Carlos Segura-Nuez: literature search, acquisition and analysis of abstracts, result analysis, figure design, discussion.
Julián Carlos Segura-Mata: study design, introduction, discussion.
DISCLOSURE OF INTEREST
The authors declare no conflicts of interest.
FUNDING STATEMENT
The authors received no financial support for the research, authorship, and/or publication of this article.