


1. Introduction
Proximal humeral fractures (PHF) account for approximately 4-6% of adult fractures and are the third most seen non-vertebral fracture after distal radius and hip fractures.1 The fracture incidence rises with age and is expected to become even higher in the upcoming years due to the increasing life expectancy and incidence of osteoporosis in this population.2
The treatment options for PHF are based on multiple factors, including but not limited to the fracture type, the quality of the bone and both patient’s and surgeon’s preference.3–5 The diversity in fracture types and patient characteristics has led to a lack of consensus on the optimal treatment plan and rehabilitation protocol.6–8
A large proportion of PHF is sustained by the working group of society where poor treatment could lead to loss of function of the shoulder joint and chronic pain symptoms resulting in, amongst others, sick leave.6,9,10 Due to a lack of scientific outcome, a factor that has not been considered in treatment decisions, is the patients timely ability to return-to-work. RTW is defined as the patients ability to successfully reintegrate into the work field and to regain full functionality of the affected limb.11 An inability to RTW after PHF has been demonstrated to be related to chosen treatment modality, severity of the injury, type of work before trauma, comorbidity’s, older age, gender and psychological factors, including motivation and self-efficacy.11–13
While several studies have investigated the clinical outcomes and functional recovery following treatment of PHF,14,15 the specific impact on Activities of Daily Living (ADL) and RTW had yet to be defined. Therefore, the aim of this study is to assess the effect of operative and conservative treatment of PHF on RTW.
2. Materials and methods
2.1. Study design
In this retrospective case-control study, we compared RTW rates between surgically and conservatively treated patients after PHF, including both part-time and full RTW. Secondary outcome measures were time to RTW measured in weeks, what type of work they returned to, functional outcomes and Quality of Life VAS-scores.
Records of patients treated for PHF between January 2018 and December 2021 in Zuyderland Medical Center were retrospectively analyzed. Questionnaires were sent out to this selected group of patients. Inclusion criteria were patients with a proven proximal humeral fracture on X-ray or CT-scan and if they were between the age of 18 and 68 (working age). Both operatively and conservatively treated fractures were included. Patients were excluded if they underwent previous shoulder operations due to other fractures, had a humeral shaft fracture, lived in other countries than the Netherlands or Belgium, received treatment in another hospital, suffered from cognitive impairment and therefore being unable to complete the questionnaire or were deceased at time of data retrieval. Ethical approval was obtained from the Medical Ethics Committee METC-Z (METZ2020012).
2.2. Data collection
Patient data were retrospectively collected from electronic data records of the hospital, provided by the business intelligence department. A multidisciplinary team consisting of trauma and orthopedic surgeons, a physical therapist and a rehabilitation physician compiled the contents of the questionnaire based on clinical experience and literature research. The envelopes contained an explanatory letter describing the research, an informed consent letter, the Return to Work after shoulder operation questionnaire (RTW-Q), the American Shoulder and Elbow Surgeons questionnaire (ASES), the Disabilities of the Arm, Shoulder and Hand (DASH), the Quality of Life-Questionnaire (EQ-5D) and return envelopes addressed to the principal investigator.
A total of 858 patient were treated for a PHF between January 2018 and December 2021. The study population was divided into two subgroups consisting of 190 operatively and 668 conservatively treated patients. All patients were seen by an trauma/orthopedic surgeon, general surgeon or emergency medicine physician. The 190 operatively treated patients were manually matched by two researchers (AH and MS) based on age and sex.
A total of 342 envelopes were sent out to the patients after matching. The operative treatment group was requested to complete the questionnaires as instructed on the forms. The conservatively treated group was instructed to interpret the questionnaires about operative treatment as if it read ‘after trauma’ instead of ‘after surgery’ and to complete the questionnaire accordingly. To ensure anonymity, study numbers were written on the return envelopes.
2.3. Patient reported outcome measures (PROMs)
The following PROMs were used: EuroQol-5D (EQ-5D) VAS scores, DASH score, RTW-Q and the ASES-scores.
2.3.1. EuroQol-5D (EQ-5D)
The EQ-5D assesses an individual’s health status focusing on different 5 dimensions. It also consists of a VAS which measures from 0-100 someone’s overall health at that moment in time.16,17
2.3.2. DASH-score
The DASH score is a questionnaire consisting of 30 items that evaluate the different aspects of upper limb function, including physical and social activities. The score ranges from 0 to 100 points, with 0 points being unrestricted function and 100 being the greatest possible functional impairment.18,19
2.3.3. Return to Work Questionnaire (RTW-Q)
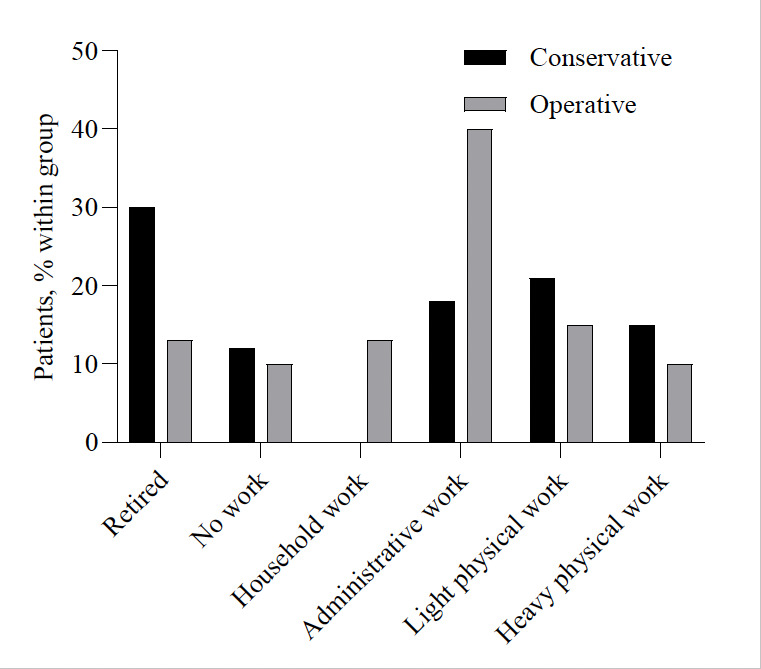
A previously approved questionnaire with questions regarding RTW after shoulder operations is used. The questionnaire gives us a better understanding of the rehabilitation process after shoulder trauma in relation to work. Type of work was divided into 6 categories: retired, light physical work, heavy physical work, administrative work, household work and no job or looking for a job (Appendix 1).
2.3.4. ASES-Shoulder score
The ASES shoulder score is an established instrument for evaluating the function and disability of patients with shoulder disorders. Originally, the ASES shoulder score comprises of two components: a patient-reported questionnaire and a physician assessment. The patient-reported questionnaire assesses pain, function, and ADL, while the physician assessment evaluates range of motion, strength and instability. For this study, we used the patient-reported questionnaire. The total ASES score for the affected limb was calculated with the following formula: X = [(10- VAS pain score) x 5] + [(5/3) x cumulative ADL score]. A score of 100 is defined as no functional impairment and 0 as great functional restrictions.19,20
2.4. Classification
Fracture classification was done according to the AO classification guidelines were employed for assessing additional imaging. The guidelines divide the fracture patterns into 3 subtypes: 11A, 11B and 11C.6
2.5. Statistical analysis
All analyses were performed with SPSS (version 29.0 software, SPSS Inc., Chicago, USA). First data were analyzed for normality (Kolmogorov test). Not-normally distributed data were analyzed with non-parametric statistics (Mann–Whitney U test). Continuous variables were described using means (±SD) or with median (IQR) if data were non-parametric. Categorical variables were tested with Chi-square tests and tabulated with absolute frequencies (%). Subsequently, a multi-variate regression analysis was performed to examine potential predictors for RTW by treatment modality, adjusting for factors significantly differing between patient groups. Lastly, a Kaplan-Meier analysis was performed for RTW in weeks. A p-value of 0.05 was considered statistically significant.
3. Results
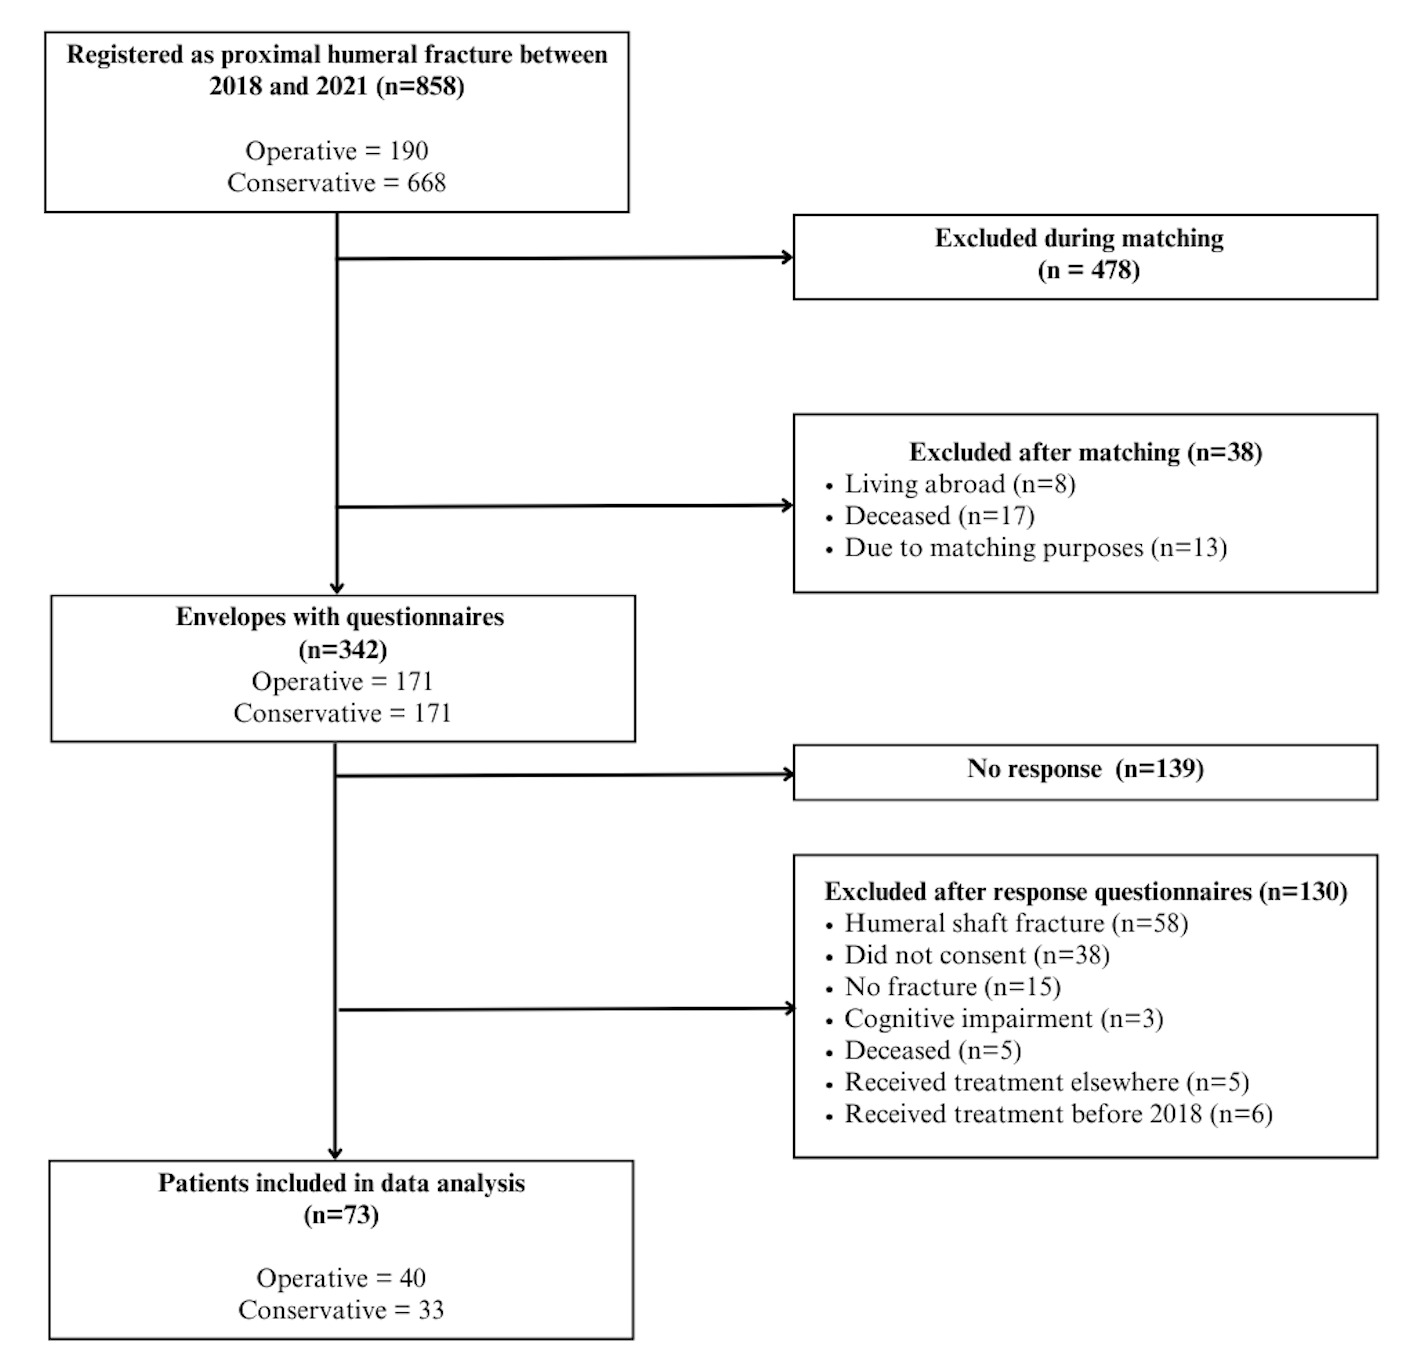
In April 2023, we matched the operative group (OG) and conservative group (CG). After matching, 8 patients turned out to live abroad (other than Belgium) and 17 past away in the meantime, which left 13 to be eliminated for matching purposes. In total, 342 letters with questionnaires were sent out after exclusion. Patients were approached by phone to remind them of the questionnaires (initial response rate of 19%). After this reminder, the response rate increased to 38%. A total of patients 73 patients were included in the analysis (Figure 1).
3.1. Patient demographics
Demographic and injury characteristics are shown in Table 1. The group consisted of 73 patients. The median age was 58 and 67.1% was female. The majority of fractures occurred due to low-energy trauma (77.8%) and in 53.7% of the cases the dominant arm was affected. In total, 14 (19.2%) patients had a complication.
3.2. Operation characteristics
40 patients received operative treatment. In total, 32 (80%) patients received plate osteosynthesis, 6 prothesis (n=1 hemiarthroplasty and n=5 total reversed shoulder prosthesis) had been placed, 1 pen fixation was performed and 1 only received screws. The median operation time was 83 minutes. The complication rate after surgery was 28% of which 9 patients received re-operation, 1 patient had an isolated cuff rupture and 1 patient filled in other. Other was defined as persistent pain or complications due to no further defined reasons. More complications were observed in the operative group vs. the conservative group (p=0.047), supplementary Table B).
3.3. Functional outcomes
3.3.1. Return to work
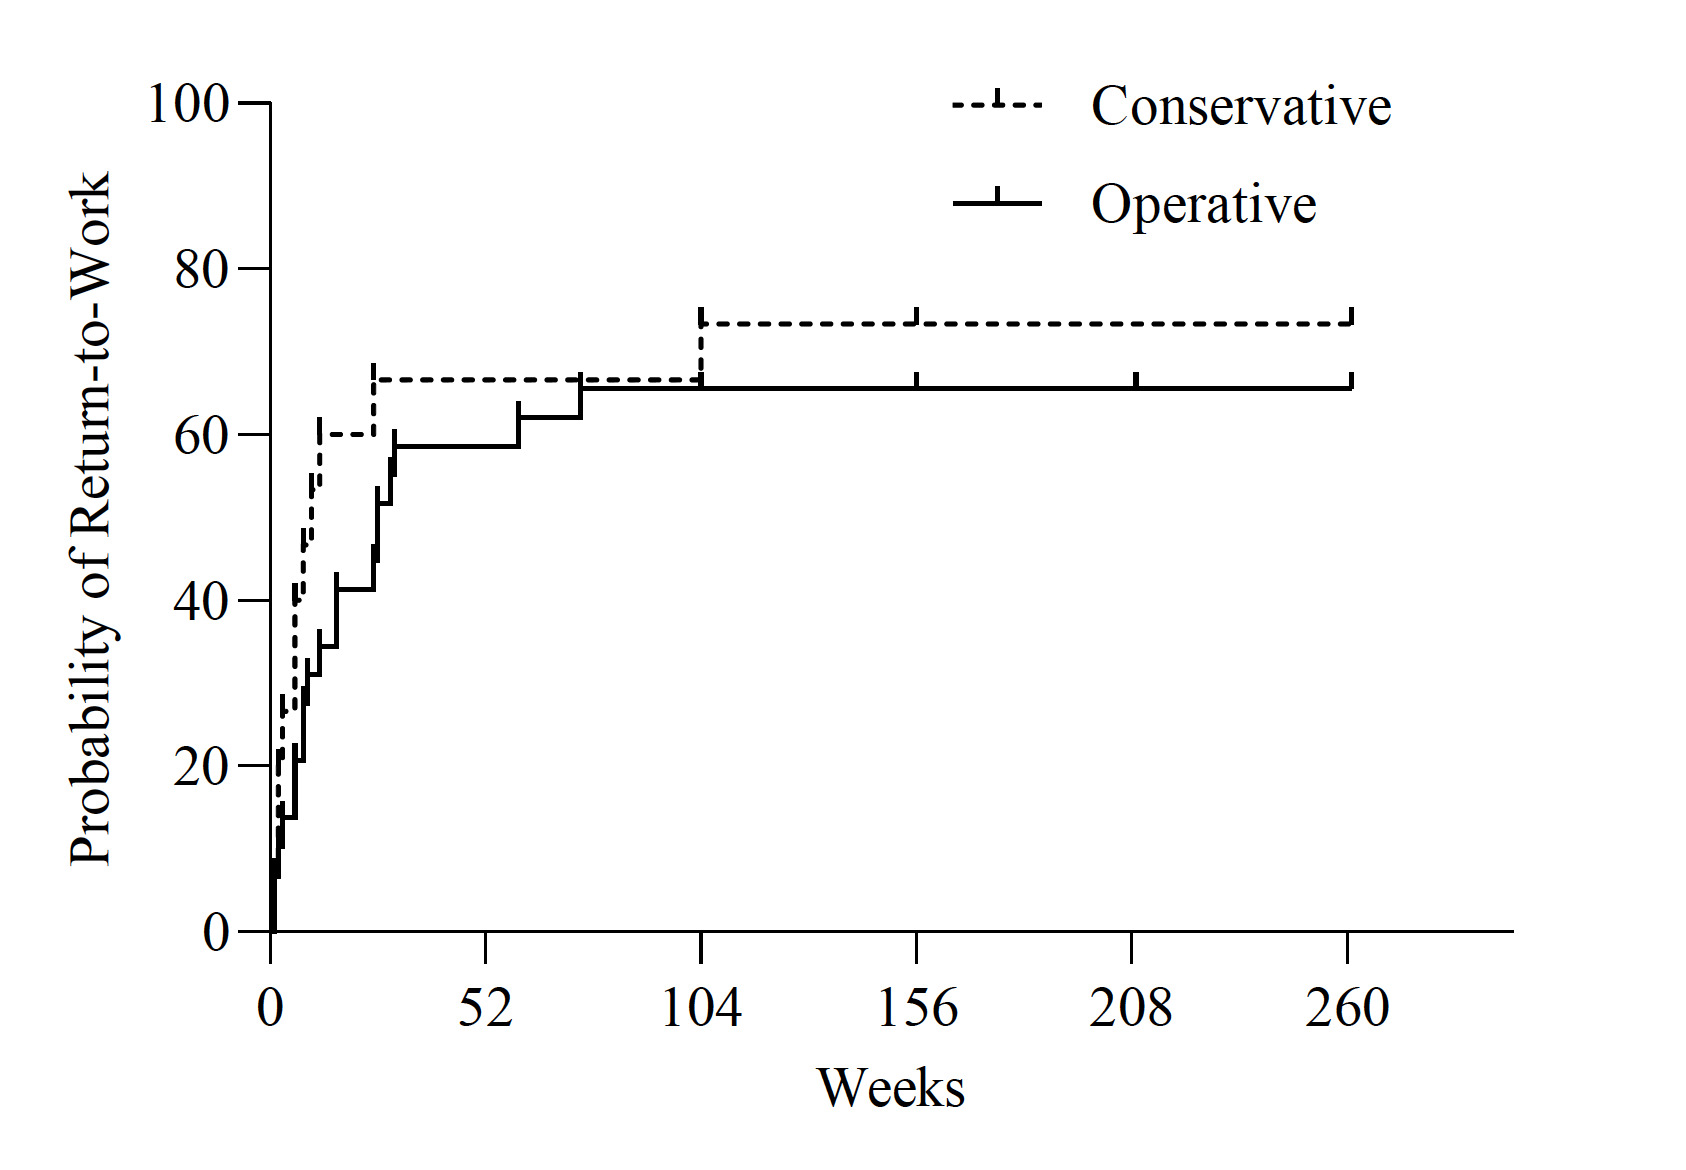
Of the 40 patients who underwent surgery, 24 (63%) were employed prior to their injury. In the conservative group who responded to the questionnaire, 15 (58%) were employed prior to their injury. Fig. 4 shows the different types of work prior to trauma for both groups. RTW was not statistically significant different between groups over time (log rank (Mantel cox) P=0.364, Figure 5). No statistical difference was seen in the proportion of patients returning to work between the groups (67%, p=0.826). The median duration to RTW was longer in the OG than in the CG (IQR 10.5 vs 6, p=0.072).
Using multiple variable regression, we sought to assess whether the type of treatment was a significant predictor for RTW (in weeks), after adjustment for other significantly different variables between treatment groups (type of fracture, physiotherapy). BMI was not included in the regression because of little available data (n=15 of 31 patients). The model did not statistically significant predict RTW in weeks (R2 = 0.159, p=0.343, Appendix D), and none of the coefficients including type of treatment were significant predictors (all p>0.3).
Full-time employment was resumed by 78% of the OG and 42% of the CG (Table 2). No patients switched jobs due to the shoulder trauma (Supplementary Table C). In the open ended questions section of the questionnaires, several patients mentioned that their PHF led to early retirement possibly increasing the percentage of patients who did not RTW full-time or did not fill in the question leading to missing data. None of the participants directly attributed their failure to RTW to the functional limitations caused by the shoulder injury.
3.3.2. PROMs
The median self-reported health status (EQ5D-VAS score) was 80.0 for both groups. Quality of life after trauma was not statistically different between the groups. DASH-scores and ASES-scores showed no statistically significant difference between the operative and conservative groups. There was no difference in duration between trauma and data collection between the operative and conservative group (difference 3±3 months, p =0.3).
4. Discussion
4.1. Main findings
In this study, we have studied the effect of surgical and conventional treatment of PHF on work recovery. The present study showed no statistically significant difference in RTW rates for both treatment types, with full-time return for 78% in the OG and 42% in the CG. Among those returning to work, patients treated surgically tended to have 4-weeks longer absenteeism. Self-reported health status and functional scores (ASES/DASH) showed no statistically significant differences and indicated good functional results for all patients included in data analysis.
4.2. Interpretation of the results
Firstly, the present findings showed 70% RTW after trauma in our study population, which is in line with previous research about similar trauma.21–23 Our study did not find a statistical significant difference in return to work rates between operative and conservative treatment groups. RTW is highly variable and dependent on multiple factors, including the patient’s age, overall health, comorbidities or socioeconomic status,11,24–26 for which our sample size was too small to account for.
Secondly, in the present study of 30 patients, we observed a lower full-time RTW for the CG (42%) in comparison to the OG (78%, p=0.097). A higher percentage of patients had already retired before suffering the PHF in the CG (31% vs. 13%). While the difference was not statistically significant, there was a socially-economic relevant trend towards earlier RTW in the CG (6.0, IQR 8) compared to the OG (10.5, IQR 22). The trend may have practical implications for patients and their employers, as even a relatively minor reduction in time taken to RTW can positively impact patient’s livelihoods, job stability, and overall well-being.12,22,23 The longer absenteeism should be considered during shared decision-making regarding the best treatment plan.
Between study groups, ie operated vs conservatively treated, a statistical difference in BMI was observed including, fracture type and consultation of a physiotherapist between groups. Body mass is an important factor considering treatment options, as such that patients with obesity are more likely treated conservatively, which is reflected in our data. A higher BMI is associated with more perioperative complications and therefore less preferable for patients with a higher body mass.27,28 In addition, 11A fracture types are treated more conservatively as opposed to the more communitive 11C fractures where surgical treatment is preferred, which is in line with previously published literature.6,29–31 Lastly, more patients in the surgery group consulted a physiotherapist. Physiotherapy is part of the standard operative treatment, while in conservative treatment, it is not standard practice. Collectively, it is important to consider the observed differences in demographic and rehabilitation factors, as they may mask or mimic any potential effects of the initial treatment on RTW rates.
In the future, in addition to appropriate, objective assessment of work resumption, better characterization and implementation of early mobilization and weight-bearing should be studies to provide an evidence base for better and earlier recovery.
4.3. Limitations of the study
A sample size of 114 participants was calculated to reach adequate power to detect a significant and clinically relevant difference in RTW between operative and conservatively treated patients. Unfortunately, a low response rate, and erroneous medical records (registered as PHF but different actual diagnosis, death, and others) precluded an appropriately powered analysis. In addition, 40% of the population was already retired when receiving the questionnaires, which led to missing data. Due to the smaller sample size, it was not possible to validate certain assumptions of hypotheses, such as the relationship between fracture type and RTW. Consequently, no definitive statements were made in this regard. Despite not reaching predefined power, the response rate in this study was comparable to other studies focusing on RTW by means of questionnaires.22,32
The retrospective nature of this study made it difficult to avoid recall bias. Patients were asked to draw up events or experiences from years ago, which adds to the chance of receiving inaccurate information. Secondly, patients could simply choose not to respond to the questionnaires which leads to self-selection bias. Self-selection bias may lead to an overestimation of RTW rates as patients who experienced a positive rehabilitation process are more likely to fill in the questionnaires. Contrary to this, patients who are left with deprivation of function after treatment returning to work may be less motivated to respond, leading to an underrepresentation in the study findings. Furthermore, patients were left with sufficient possibilities to share their experiences on paper which allowed for maximum information extraction and with that avoiding selection bias. Lastly, due to the retrospective design it is difficult to identify other possible factors besides fracture type that might have influenced the choice of treatment, such as patients preference and surgeons medical expert knowledge. Replication of the study in a multi-center trial with a prospective design would be preferable to validate the present findings.
5. Conclusion
The present study highlights the impact of different types of treatment on RTW outcomes in patients with PHF. 70% of all patients return back to work after trauma with all patients returning back to their previous jobs. Time to work resumption was longer in surgically treated patients. Importantly, results are based on self-report and relatively small study groups. Prospectively designed studies with a larger sample size are needed to validate our preliminary findings. Furthermore, clinical studies on rehabilitation modalities, e.g mobilization and permissive weight bearing, are ongoing and are advised to consider work resumption as an important patient-related and societal outcome. Combined, such studies would assist in creating a standardized treatment protocol in the upper extremity and usage of more objective measurements to provide faster regain of function and thus possible faster return back to work.
Acknowledgments
We are grateful to all the patients who filled in the questionnaires.