_and_subgroups__age_(b)__gender_.tiff)
Introduction
Osteoporosis (OP) is a chronic metabolic bone disease marked by low bone mass and damage to bone tissue’s microstructure. This condition increases bone fragility and the risk of fractures.1 The current global prevalence of osteoporosis is approximately 19.7%, with a prevalence of osteopenia around 40.4%,2 affecting about 23.1% of women and 11.7% of men; there is a trend of increasing incidence year by year.3 Osteoporotic fractures from this disease can lead to a reduced quality of life for patients, accompanied by high rates of disability and mortality. The economic burden is substantial, costing approximately $1.79 billion in the United States and £4 billion in the United Kingdom each year.4
Osteoporotic fractures primarily consist of compression fractures of the vertebral body, which account for approximately 50% of cases.5 The most frequently injured level is the T12 vertebra, representing 25.7% of these fractures.6 Bone mineral density (BMD) testing is the gold standard for diagnosing osteoporosis; therefore, monitoring trunk bone BMD(TBBMD) is beneficial for preventing osteoporotic vertebral fractures.7
In recent years, many studies have explored the correlation between BMD and grip strength. Sousa-Santos and Amaral suggest that low grip strength is an indicator of osteoporosis and subsequent fractures, which may collectively increase the risk of mortality.8 Some studies have found a significant positive correlation between dominant hand grip strength(HGS) and the adjacent radial bone mineral density (BMD),9 but grip strength has no predictive value for lumbar and femoral neck BMD.10 Na Wu and Yingying Luo found that grip strength may be related to the BMD of non-adjacent bones in the NHANES database survey,11 and dominant HGS can be an indicator of BMD across different genders and menopausal status in the general U.S. population.12 This appears contradictory to the earlier findings regarding lumbar and femoral neck BMD, and some scholars question the relationship between maximum grip strength and proximal femoral BMD. They argue that the accompanying effects of body weight on BMD and muscle strength cannot be ignored.13
The author of this article also believes that the dominant hand does not fully reflect the bilateral limb strength, and therefore cannot objectively represent the BMD of areas such as the trunk, lumbar vertebrae, and femur. To control for weight factors, some researchers have calculated relative hand grip strength by dividing absolute HGS by body mass index (BMI).14 Moreover, some researchs from Min Jin Lee and Yoo Mee Kim confirmed the association between relative grip strength and chronic cardiometabolic conditions, diabetes, impaired fasting glucose, and musculoskeletal diseases.15,16
Therefore, the author believes that the algorithm for relative grip strength—calculated as the sum of the maximum grip strength of both sides divided by BMI—may be more balanced and scientifically valid. It may also have a more stable relationship with BMD, potentially enabling the development of a better predictive model.this study uses the algorithm that divides the sum of the maximum grip strength of both sides by BMI to control for obesity-related weight effects. Using NHANES data from 2011 to 2014, the study investigates the association between Relative Grip Strength Index (RGSI) and TBBMD. The goal is to identify a more convenient and reliable indicator to monitor trunk bone health and aid in preventing and treating vertebral compression fractures.
Materials and methods
Ethical approval
The ethic review board of the National Center for Health Statistics approved all NHANES protocols.
Data source and study population
The National Health and Nutrition Examination Survey (NHANES) is a critical ongoing cross-sectional survey in the United States, designed to provide objective statistical data on health trends and address emerging public health challenges. This study utilized NHANES data from 2011 to 2014, obtained through the official NHANES website (https://www.cdc.gov/nchs/nhanes/). All survey procedures were approved by the Institutional Review Board of the National Center for Health Statistics, and written informed consent was obtained from each participant for research use of their data.
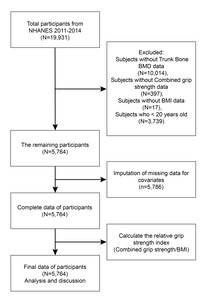
Among 19,931 initially eligible participants, we excluded subjects through a stepwise process:
10,014 individuals with missing TBBMD data;
397 with missing combined grip strength measurements;
17 with unavailable BMI records;
3,739 aged below 20 years.
Consequently, 5,764 participants were included in the final analysis.
Data integration followed the standard NHANES weighting protocol, merging datasets according to the complex survey design. Additionally, 5,786 missing covariate values were imputed based on NHANES guidelines. The RGSI was calculated as a key exposure variable. The research flow is shown in Figure 1.
Study variables
Trained and certified radiologic technologists performed dual-energy X-ray absorptiometry (DXA) using the Hologic Discovery A device (Hologic, Inc., Bedford, Massachusetts). Software versions Apex 3.2 and Hologic APEX 4.0 were used for analysis to assess trunk bone BMD (TBBMD). The Relative Grip Strength Index (RGSI) is a weight-adjusted variable to control for weight influence, calculated as the sum of maximum grip strength from both limbs divided by BMI. Combined grip strength (kg) refers to the sum of the highest grip strength readings from both hands. Muscle strength was measured using a dynamometer under professional guidance. Each hand was tested three times. BMI was calculated as weight (kg) divided by height (m) squared and rounded to one decimal place. Body measurements were collected by trained health technicians at the Mobile Examination Center (MEC).
Covariates
Covariates need to be included to test the stability of RGSI and TBBMD in a multivariable model. These covariates include gender, age, weight, height, BMI, marital status, family income to poverty ratio (FIR), education level, alcohol(how many cups of alcohol consumed daily in the past year), activity(minutes of moderate activity per day), total cholesterol, vitamin D, hypertension (whether diagnosed with hypertension by a doctor), diabetes (whether diagnosed with diabetes by a doctor), cancer (whether diagnosed with cancer by a doctor), smoke (having smoked at least 100 cigarettes in a lifetime up to the data collection), and sleep status (how many hours slept each night). The NHANES website (https://www.cdc.gov/nchs/nhanes/) provides a detailed explanation of how these variables are calculated.
The definition of covariates explains that alcohol refers to the number of drinks consumed daily over the past year, that is a continuous variable. Smoke was classified as a binary variable. An individual is considered a smoker if he or she has smoked at least 100 cigarettes in their lifetime up to the time of data collection; otherwise, he or she is classified as a non-smoker.
Statistical analysis
Stratified multivariate regression analysis was adopted. We used the Chi-square test for categorical variables and a weighted linear regression model to calculate the differences between groups for continuous variables. Subgroup analysis was conducted through stratified multivariate regression analysis. The nonlinear relationship between RGSI and TBBMD was also addressed using smooth curve fits and generalized additive models. Upon identifying nonlinearity, we applied a recursive method to compute the inflection point in the relationship between RGSI and TBBMD. Subsequently, two-piecewise linear regression models were applied on both sides of the inflection point. R4.4.3 (http://www.r-project.org) and EmpowerStats (http://www.empowerstats.com) were used for all analyses; a P value of 0.05 was deemed statistically significant.
Results
As shown in Table 1, this study included a total of 5,764 participants aged between 20 and 59 years; male individuals accounted for 52.186% and female individuals for 47.814%. The average age of the participants was 39.006 ± 11.545 years. Based on the participants’ RGSI levels (Q1: 0.505 - 2.065; Q2: 2.067 - 2.696; Q3: 2.696 - 3.428; and Q4: 3.428 - 7.019), the average TBBMD of all participants is 0.900 ± 0.114. Notably, the TBBMD increased with the rise in RGSI quartiles (Q1: 0.864 ± 0.102; Q2: 0.880 ± 0.104; Q3: 0.913 ± 0.113; Q4: 0.941 ± 0.122; P<0.001), suggesting a positive association between RGSI levels and TBBMD.
Between the RGSI quartiles, there are statistically significant differences in age, gender, weight, height, BMI, FIR, activity, total cholesterol, vitamin D, TBBMD, sleep status, marital status, diabetes, hypertension, education level, cancer, and smoke (all P<0.05). Compared to the lowest RGSI group, participants in the RGSI increase group are more likely to be male, taller, have a higher FIR, engage in more activity minutes, be unmarried or living with a partner, have higher vitamin D levels, and have a higher prevalence of smokers. In contrast, they have lower weight, consume less alcohol, have lower total cholesterol, and include fewer widowed, divorced, or separated individuals, as well as fewer people with hypertension, diabetes, and cancer (all P<0.05).
The results of the multiple regression analysis are shown in Table 2. In the unadjusted model, RGSI and TBBMD were positively correlated (β =0.033, 95%CI[0.029, 0.036], P<0.00001). After adjusting for Gender and Age in Model 2 (β =0.013, 95%CI[0.009, 0.017], P<0.00001) and adjusting for all covariates Model 3 (β=0.035, 95%CI[0.030, 0.041], P<0.00001), this significant correlation remained evident. When RGSI was converted from a continuous variable to a categorical variable (quartiles), participants in the highest RGSI quartile (Q4) in Model 1 had TBBMD values 0.077 g/cm² higher than those in the lowest quartile (Q1). Similarly, in Model 2, the difference was 0.028 g/cm², and in Model 3, it was 0.070 g/cm² higher. The P for trend was < 0.00001 across all models.
The RGSI and TBBMD were positively correlated in women (β=0.050, 95%CI[0.040, 0.059], P<0.0001) and in men (β=0.032, 95%CI[0.026, 0.038], P<0.0001), with a higher correlation in women, and the difference between them was statistically significant (P=0.0004; <0.05). A positive correlation was maintained across all age groups, and the differences between subgroups were statistically significant (P=0.0184; <0.05), while the P for trend was 0.3661. Vitamin D was divided into four dosage subgroups, all of which maintained a positive correlation, and the differences between them were statistically significant (P=0.0210; <0.05), but the P for trend was 0.0651. The two subgroups of the four variables—Smoke, Cancer, Diabetes, and Hypertension—are positively correlated in both cases, but there is no statistically significant difference between their subgroups. Alcohol was divided into four dosage subgroups, all of which maintained a positive correlation, but the differences between them were not statistically significant (P=0.1519; >0.05), with the P for trend being 0.0694. In the marital status subgroups, widowed showed no correlation, while the others were positively correlated, and the differences between subgroups were not statistically significant (P=0.3003; >0.05), with the P for trend at 0.9999. See Table 3.
The curves A, B, C, D in Figure 2 and Table 4 respectively show the generalized additive models and threshold effects of the total variable group and the various subgroups stratified by age, gender, and vitamin D levels, which are used to describe nonlinear associations between RGSI and TBBMD in each group. The total variable group, subgroup by age ≤ 30 years, male subgroup, female subgroup, and vitamin D Q4 subgroup all show an inverted U-shaped curve in the relationship between RGSI and TBBMD. The inflection point for the total variable group is at 4.935. The inflection points for the subgroups by age ≤ 30 years, male, female, and vitamin D Q4 are at 4.975, 4.999, 3.088, and 4.458, respectively. The correlation before each inflection point is positive but negative thereafter. The P values were all less than 0.05. This suggests statistical significance.However, in the population over 30 years old, RGSI is not negatively correlated with TBBMD, showing an approximately linear relationship.
_and_subgroups__age_(b)__gender_.tiff)
Discussion
Multiple regression analyses in this study indicate that for the vast majority of subjects, the participants with higher RGSI in the total group and various subgroups may have higher TBBMD, except for the widowed population. In the total group, Age≤30, Male, Female, and Vitamin D Q4, TBBMD is negatively correlated with RGSI after reaching a certain value. However, in the population over 30 years old, the relationship between RGSI and TBBMD is approximately linear. The results of this study suggest that RGSI may be suitable for predicting TBBMD, especially in populations over 30 years old.
It is well known that lower BMD indicates a more severe degree of osteoporosis.17 Relevant studies have shown a positive correlation between BMD and sarcopenia.18 A bi-directional Mendelian randomization study conducted by Chao Liu and Colleagues indicates that OP and sarcopenia might mutually have a significant causal effect on each other.19 Muscle strength is one of the indicators for measuring sarcopenia.20 Sarcopenia often implies a decrease in muscle strength, and numerous studies have shown that muscle strength is closely related to BMD. Hanmei Qi et al. found in a study involving 318 Chinese men and 203 Chinese women that the reduction in muscle mass and strength is significantly associated with decreased bone mass and deterioration of bone microstructure.21 Mehmet Selman Ontan et al. found that muscle weakness or sarcopenia is related to reduced BMD and osteoporosis of the femoral neck.22 Huawei Han et al. found in a NHANES research that lower limb strength and muscle mass were positively associated with BMD in American adults.23 In a study conducted in Lebanon aimed at analyzing the relationship between limb muscle strength and BMD in 55 subjects (35 females and 20 males), it was found that limb muscle strength was positively correlated with hip BMD.24
The strength of the muscles that attached to the vertebrae plays a key role in vertebral BMD. Chun-Han Hou et al. found that the size of the erector spinae and multifidus muscles in the osteoporosis group was significantly positively correlated with lumbar and femoral neck BMD.25 Satoshi Kato et al. found that abdominal trunk muscle weakness in middle-aged and elderly women was positively correlated with osteoporotic vertebral fractures.26 Some studies have also shown that muscle strength training or resistance exercise can increase femoral/hip mineral density and alleviate sarcopenia and bone loss/osteoporosis.27In addition, reduced grip strength is closely related to lumbar BMD and spinal compression fractures.28 A study conducted in 2005 that recruited 1,265 men and 1,380 women aged 50 and older further found that low grip strength is associated with low BMD in the spine and hip, as well as an increased risk of vertebral fractures.29 A Mendelian randomization study conducted by Yingying Zhu et al. indicates a causal relationship between grip strength decline and the risk of osteoporosis in the population aged 45-60, while more evidence is needed to confirm this causal relationship.30
In summary, osteoporosis and sarcopenia are common comorbidities, and BMD is positively correlated with muscle strength. Some studies have explored the mechanisms of their interaction from multiple aspects. Ken-Ichiro Tanaka’s research found that mouse bones and muscles may be involved in mutual regulation through the FAM210A gene.31 Bing-Na Zhou and others found that grip strength in castrated rats is positively correlated with femoral trabecular and bone volume/total volume. Serum sclerostin levels are negatively correlated with femoral trabecular BMD and grip strength, while serum irisin levels are positively correlated with femoral trabecular BMD.32 Although the above studies have made efforts, there is still no consensus on the interaction mechanism between BMD and muscle strength, and more in-depth research is needed to clarify this.
This study uses RGSI as a substitute for simple grip strength, its mechanism is not different from grip strength; however, the RGSI algorithm controls for body weight factors, which may be more balanced and scientifically valid.14 According to the results of this study, it is also more stable. Some studies suggest that BMI is positively correlated with BMD33; higher BMI may indicate greater muscle mass, which could lead to increased muscle strength.34 However, high BMI does not exclude the possibility of high fat and low muscle mass, and fat is negatively correlated with BMD.35 These findings indicate that research focusing solely on the association between grip strength and BMD lacks sufficient rigor.
The obese population has strong grip strength, but their body size is large. Although they have a lot of muscle mass, it may not necessarily account for a large proportion of their body, and thus does not necessarily indicate high BMD. If muscle strength is high and BMI is low, it indicates that muscle mass accounts for a large proportion of body. If muscle strength increases with BMI, their muscle mass proportion in body remains stable. Conversely, if muscle strength is low and BMI is high, it indicates that the muscle proportion may be very low. Therefore, the RGSI algorithm ( Combined grip strength/ BMI ) appears to be a more comprehensive and stable measure. Considering the theory that sarcopenia negatively correlates with BMD, using RGSI to assess BMD may be more scientific and objective.
This study shows that RGSI positively correlates with TBBMD and remains stable across the three models. In individuals under 30, RGSI and TBBMD negatively correlate after the inflection point (4.975). This may be due to their youthful energy and active lifestyles, which lead to stronger muscles, while BMD has not yet peaked.36 In the Vitamin D Q4 with the highest content interval, RGSI and TBBMD negatively correlate after the inflection point (4.458). Some studies have found that high doses of Vitamin D can reduce BMD,37 which aligns with the findings of this study. However, further research is essential to fully understand these findings.
In the future, the results of this study may help predict TBBMD, particularly in individuals over 30 years old. After optimization, it could become a convenient tool for measuring TBBMD, enabling early intervention for potential spinal compression fractures.
As far as we know, this is the first application of the NHANES database to explore the association between RGSI and TBBMD. This study has a large sample size, selecting a nationally representative sample based on the NHANES database and made weight adjustments. This approach guarantees high applicability for the entire adult population. Additionally, we performed multiple subgroup analyses and threshold effect analyses while adjusting for numerous covariates, enhancing the depth and reliability of this study. However, this research on the association between RGSI and TBBMD is cross-sectional, which cannot determine a causal relationship. At the same time, due to the lack of BMD reports for the population over 59 years old and the application of glucocorticoids in the NHANES, we were unable to include this data in the study. We hope that future research can address this regret.
Conclusion
An elevated RGSI was significantly associated with higher TBBMD levels in the population aged 20 to 59 in the USA.These findings suggest that RGSI could serve as a potential predictor for TBBMD in future clinical practice. Collectively, this study highlights the importance of RGSI in assessing TBBMD; however, more comprehensive investigations are required to validate these observations and elucidate their causal relationships.
Abbreviations
OP:osteoporosis; RGSI: relative grip strength index;TBBMD: trunk bone BMD ; NHANES, National Health and Nutrition Examination Survey; BMD: bone mineral density;BMI:body mass index;HGS: hand grip strength; GED: general educational development.
Acknowledgment
The authors thank the participants for their voluntary participation, patience, and availability.
Credit authorship contribution statement
Hui Pan: Conceptualization, Methodology, Validation, Formal analysis, Investigation, Writing - Original Draft, Writing - Review & Editing, Visualization.
Zhijie Weng: Methodology, Validation, Formal analysis, Investigation, Writing - Original Draft, Writing - Review & Editing, Visualization.
Xiaojun Chen:Collect cases data, Formal analysis, Chart making,Investigation, Visualization.
Chao Wang:Validation, Formal analysis, Investigation, Visualization.
Liwei Liu:Validation, Formal analysis, Investigation, Visualization.
Guangyang Lin:Validation, Formal analysis, Investigation, Visualization.
Zejie Chen:Validation, Formal analysis, Investigation, Visualization.
Shuxiang Chen: Validation, Writing - Review & Editing, Visualization.
Zhijun Ding:Conceptualization,Methodology, Validation,Writing - Review & Editing, Visualization.
Hui Pan and Zhijie Weng contributed equally.
Competing interests
There are no relevant financial or non-financial competing interests to report.
Funding
This research received no specific grant from funding agencies in the public, commercial, or not-for-profit sectors.
Consent for publication
Not applicable.
Availability of data and materials
The NHANES dataset is publicly available online for data analysts and researchers (www.cdc.gov/nchs/nhanes/).