Introduction
Level I trauma centers employ a variety of call strategies for orthopaedic trauma coverage based on their volume and surgeon subspecialty availability. Historically, a small number of Level I centers have employed designated orthopaedic trauma service call plan, with the remainder employing other mixed call coverage plans.1 These plans involve orthopaedic surgeons of a variety of subspecialities covering call and triaging complex cases to their trauma-trained partners post call.2,3 Lachiewicz et al. demonstrated 59% of residency training programs utilize this system in their 2008 survey study.3 It is clear that the field of orthopaedic trauma lacks broad standardization in the surgeon characteristics of the on-call teams.
The lack of standardization may be significant in that implementations of on call trauma teams could improve patient care and revenue. Recent evidence suggests timely fixation of certain injuries can reduce the incidence of complications, length of stay and decrease costs.4–6 Additionally, it has been described that the implementation of an orthopaedic trauma program can increase hospital net revenue by approximately $7 million annually, further strengthening the case for the implementation of dedicated trauma care.7 To our knowledge there has not been a study explicitly analyzing patient outcomes with respect to orthopaedic subspecialty training of the on-call orthopaedic surgeon.
To address this question, we plan to perform a retrospective cohort study to determine if patient outcomes are influenced by whether orthopaedic trauma surgeons are on call versus a combination of trauma surgeons and other subspecialties. We hypothesize that patient length of stay, time from admission to index surgical procedure, and complications will be decreased when orthopaedic surgeons who have completed a trauma fellowship are the sole surgeons taking call compared to a combined subspecialty call plan.
Methods
Ethical Considerations
This study was reviewed and deemed an exempt retrospective study by our institution’s local Institutional Review Board (IRB-01). Study approval number was 2024-01552. Data was stripped of patient identifiers once the data collection was completed by the study team, prior to data analysis. The data was password protected and secured on an institutional approved server.
Detailed Methods
Patients who underwent surgery for either femoral neck, intertrochanteric, subtrochanteric, femoral shaft, distal femur, tibia shaft, pelvic ring or acetabulum fractures at an academic, level one trauma center were identified by querying the medical record for Current Procedural Terminology (CPT) code as follows: femoral neck fractures (27125, 27236, 27235), intertrochanteric femur fractures (27244, 27245), femoral shaft fractures (27506, 27507), distal femur fractures (27511, 27513, 27514), tibia shaft fractures (27758, 27759), acetabulum fractures (27226, 27227, 27228) and pelvic ring injuries (27216, 27217, 27218).
These patients were then divided into two cohorts. The first cohort was taken from a period when four fellowship trained orthopaedic trauma surgeons were taking call at the facility (9/1/2015-9/1/2017). The second cohort drew from a period when there were a combination of three trauma surgeons and two orthopaedic sports surgeons taking call at the facility (9/1/2021-9/1/2023). The cohorts were chosen because they were stable in the surgeons being employed and taking call. However, three of the trauma surgeons had turned over between the first and second cohort. In the mixed call cohort, trauma surgeons were on call 79% of the days and non-trauma surgeons on call 21% of the days. All trauma surgeons in the study routinely performed pelvis and acetabulum fracture cases. There were no changes in dedicated ortho trauma room access or hospital bed capacity during the study.
The following baseline patient characteristics were then retrospectively collected from the medical record: age, sex, body mass index (BMI), Injury Severity Score (ISS), Charlson Comorbidity Index (CCI), and mechanism of injury. The following outcome data was then collected: time from admission to operating room, length of stay (LOS), and 90-day incidence of mortality, venous thromboembolisms (VTE), readmission and reoperation. Patients were excluded if they were younger than 18 years old, older than 89 years old, had less than 90 day follow up, or if their medical record lacked sufficient data for the study endpoints.
Statistical Analysis
Descriptive statistics were calculated using the mean with standard deviation (SD) for continuous variables and total number (n) with percentage for categorical variables. Patient baseline characteristics, injury characteristics, and post-operative outcomes were compared between trauma surgeons only and combination of subspecialities using Fisher’s exact test (categorical variables) or a Wilcoxon rank sum test (continuous and ordinal variables). A subgroup analysis based on fracture location was also performed. No adjustment for multiple testing was made in these exploratory analyses and p-values less than 0.05 were considered statistically significant. All statistical tests were two-sided. Statistical analyses were performed using R Statistical Software (version 4.2.2; R Foundation for Statistical Computing, Vienna, Austria). The datasets generated during and/or analyzed during the current study are not publicly available but are available from the corresponding author on reasonable request.
Results
One thousand eight hundred and ninety-one patients were initially reviewed. 857 patients in the trauma cohort and 992 patients in the combined cohort met the inclusion criteria. When analyzing patient demographics, there were statistically significant differences in the trauma cohort versus combined cohort in terms of mean age (47.2 yrs vs 53.8 yrs, p<0.001), sex (62.71% male vs 55.14% male, p 0.003) and CCI (0.9 vs 1.56, p<0.001). The mechanism of injury was similar between the groups except for more motor vehicle collisons (32.2% vs 24.5%, p<0.001) and motorcycle collisions (13.0% vs 9.8%, p 0.031) in the trauma cohort and more ground level falls in the combined cohort (25.1% vs 41.8%, p<0.001). Regarding fracture differences between the cohorts, there were more femoral neck fractures (10.97% vs 19.96%, p<0.001) and distal femur fractures (4.67% vs 6.96%, p 0.037) in the combined cohort. The trauma cohort contained more tibia shaft (21.12% vs 17.24%, p 0.034) and pelvic ring injuries (11.67% vs 5.85% p <0.001) (Table 1).
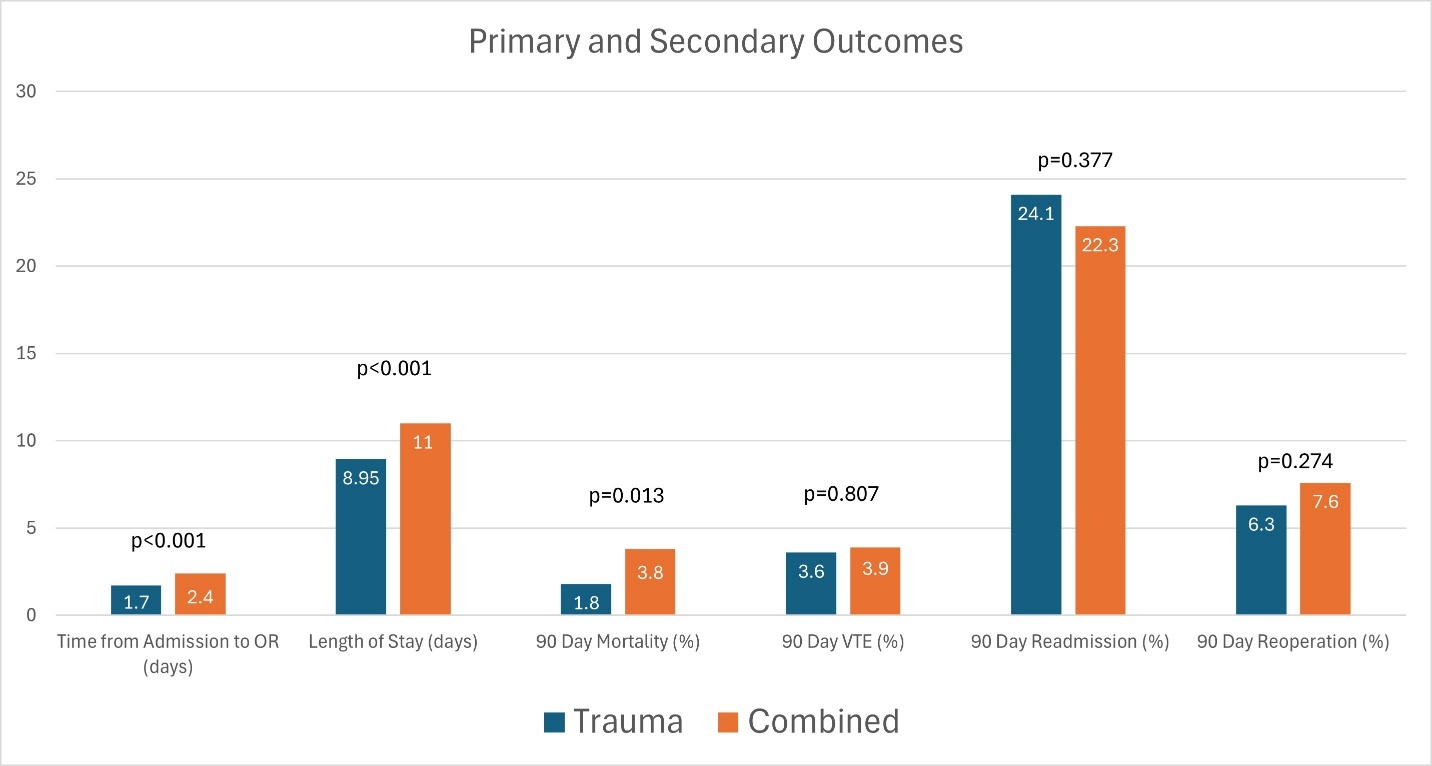
The primary outcome of mean time from admission to the operating room was significantly shorter in the trauma cohort (1.7 days vs 2.4 days, p <0.001). Mean LOS (8.95 days vs 11.0 days, p <0.001) and 90-day mortality (1.8% vs 3.8%, p 0.013) was also lower in the trauma cohort. There were no differences in 90-day rates of VTE (3.6% vs 3.9%, p 0.807), readmission (24.1% vs 22.3%, p 0.377) and reoperation (6.3% vs 7.6%, p 0.274) (Table 2) (Figure1).

Primary and secondary outcomes were then analyzed based on fracture location. There were no differences in any outcome for femoral neck fractures. For intertrochanteric femur fractures, time from admission to OR (1.36 days vs 1.71 days, p 0.017) and readmission (23.0% vs 15.0%, p 0.046) showed small differences. For femoral shaft fractures, the most significant differences were seen in mortality (0% vs 4.1%, p 0.008) and readmission (18.0% vs 30.6%, p 0.006). Distal femur fractures only showed small differences in time to OR (2.48 days vs 3.49 days, p 0.037). Tibia shaft fractures demonstrated increased LOS (7.08 days vs 10.4 days, p 0.014) and readmission (25.3% vs 38.5%, p0.049) in the combined cohort. Notable differences occurred with acetabulum fracture time to OR (2.57 days vs 5.11 days, p <0.001) and LOS (9.16 days vs 15.39 days, p <0.001). There was a similar trend with pelvic ring injury time to OR (2.3 days vs 4.57 days, p<0.001) and LOS (13.61 days vs 20.97 days, p <0.001) (Table 3).
Discussion
Time to OR
Our study found a significant difference in time from admission to the OR when only trauma surgeons were taking call compared to a combined call plan (1.7 vs 2.4 days). While 0.7 days (almost 17 hours) may not be clinically significant for every orthopaedic injury, outcomes of patients with long bone and hip fractures are dependent on efficient care. Evidence has established that the time to fixation of long bone and hip fractures has significant downstream effects on complication rates, length of stay, and hospital cost, with the optimal fixation window being within 24 hours of initial injury in resuscitated and medically optimized patients. In femur and tibia fractures, fixation prior to 24 hours reduces complication rates from 42.9% to 18.9% and LOS from 18.5 days to 10.6 days when compared to delayed fixation.4 Similarly, it has been shown that fracture fixation within a 36-hour window reduced hospital LOS days from 15.3 to 9.4 and ICU days from 9.4 to 4.5.6 Further, in proximal femur fractures, fixation within 24-48 hours of admission is critical in minimizing complications, particularly in geriatric patients.8 Achieving earlier fixation in these fractures reduces morbidity and mortality, and it is known to reduce the risks of complications such as pneumonia, DVT, and long term diminished functional independence.8,9
When the cohorts were stratified based on fracture type, time from admission to OR was most pronounced for the acetabulum and pelvis fractures. On average, acetabulum and pelvis fractures in the combined cohort were fixed 2.5 days later and 2.27 days later, respectively. Fixation of unstable pelvic ring and acetabular fractures within 24 hours of admission reduces complication rates from 19.7% to 12.4%, ICU stay days from 9.9 to 8.1, pulmonary complication rates from 25% to 12.7% and ARDS development rates from 12.6% to 4.8%.5 Other findings have shown that delayed fixation in similar cases significantly increases total hospital LOS and ICU days and adds an additional $14,829 in hospital cost per patient.10 Similarly, when acetabular surgery is performed in a shorter 6-hour window from time of admission, the LOS decreases from 5.68 to 4.11 along with $15,400 in cost savings per patient.11 However, this trend does appear to be somewhat variable, as no significant difference in mortality rates based on timing exists for geriatric acetabular fractures, suggesting that in this subgroup, comorbidities may have a stronger influence than timing.12
Length of Stay
The results for length of stay were similar to time to OR with the trauma only cohort demonstrating about 2-day shorter LOS compared to the combined cohort (8.95 days vs 11.0 days). When further comparing the two cohorts by fracture type, the most significant differences were demonstrated in the acetabulum fractures (9.16 vs 15.39 days), and pelvic ring injuries (13.61 vs 20.97 days). There are many negative consequences to increased length of stay such as increased risk of acquiring hospital acquired infections, increased costs and limiting a bed for other incoming trauma patients.6,13 Cost savings from reducing LOS in trauma cases have been noted to average over $15,000 per case.10 Implementing a dedicated Saturday orthopaedic trauma OR in a Level I trauma center reduced LOS by nearly 3 days and downstream led to over $1.13 million dollars a year in hospital cost savings.14 However, LOS is influenced by numerous factors that are out of the orthopaedic trauma teams’ control including but not limited to patient funding status, case management resources, insurance authorization delays, and availability of rehabilitation facilities.15,16
The time to OR and LOS differences in these cohorts can possibly be explained by differences in surgeon specialization. However, this should not be overlooked by busy trauma systems looking to optimize the throughput of their systems. Moving patients through the trauma system will inevitably slow down if surgeons on call are not capable of treating complex orthopaedic injuries. Orthopaedic trauma surgeons have demonstrated increased efficiency with trauma cases compared to their peers by reducing procedure time, decreasing supply costs, and decreasing surgical team labor costs.17 This delay will be worse during times of extended call periods like weekends and long holidays. However, having a trauma surgeon on call at all times should not come at the risk of surgeon burnout.
Burnout
Orthopaedic surgeons in general face significant risks of burnout due to the job’s high demands. For the orthopaedic trauma surgeon, hours exceeding 80 a week and taking call greater than 2 times a week place a surgeon at a 50% higher risk of burnout.18 Past studies have placed 40% of young orthopaedic trauma surgeons working 70 or more hours at week, placing many in the field at the threshold of significant burnout risk.18 The chronic stress of burnout leads to adverse effects in the life of the surgeon as well as a linkage to poorer patient satisfaction.18,19 Efforts to combat surgeon burnout have been successful by adequately staffing a practice with enough surgeons to distribute the call workload as surgeons in larger practices tend to report improved career satisfaction.20
However, for many practices reduced hours often prove difficult due to an ongoing shortage of trauma trained orthopaedic surgeons.21 To answer the question of how many surgeons are necessary, past modeling has produced useful data that can guide the conversation of what determines adequate call without overextending surgeons. For example, past suggestions are that for centers with less than 100 yearly emergent trauma procedures performed within 24 hours of admission, mandatory backup is not warranted, helping ease surgeon shared hours.22 These models and updated studies can help hospital systems as they navigate this balance.
Mortality
The trauma-only cohort demonstrated an overall lower incidence of 90-day mortality compared to the combined cohort (1.8% vs 3.8%). While the mortality trend was consistent amongst most fracture types, it was only statically significant in the femoral shaft fracture group (0.0% vs 4.1%). Many factors influence mortality rate in trauma patients including the initial health of the patient, Injury Severity Score, Glascow Coma Score, quality of care, timeliness of care, insurance status, and comorbid conditions.16,23 Additionally, the age of the patient can often be a significant factor in predicting the trauma patient’s outcome.12 One confounding factor when interpreting the mortality results in our study is that while the ISS scores were similar, the CCI was higher in the combined call group (0.9 vs 1.56). Therefore, this group had worse baseline health and would be expected to have a higher mortality rate in isolation of sustaining a traumatic injury.
Limitations
There are several limitations of our study. First, it is a retrospective, single center study and the findings may not be generalizable to all trauma centers. Next, the trauma cohort had 135 fewer patients compared to the combined cohort. It also included younger (47.2 yrs vs 53.8 yrs) and healthier patients based on CCI (0.9 vs 1.56). While difficult to study, the trauma surgeon turnover between cohorts could lead to differences in surgeon skill, efficiency and thus patient throughput. The increased volume stresses the local trauma system’s limited resources such as operating room time, anesthesia staffing, critical care resources, case management resources, etc. These resources have been relatively unchanged during the time period of this study and may explain some of the differences in the cohorts. In addition, we did not account for delays attributed to patient instability or other services taking priority in patient care (ie. general surgery trauma management, neurosurgical intervention). However, the ISS scores were similar between groups so ideally such delays would occur with similar frequency.
Conclusion
To our knowledge, this is the first study to compare orthopaedic trauma patient outcomes based on the orthopaedic subspeciality taking call. Our findings suggest that when trauma fellowship trained surgeons are the only ones taking call patients have a shorter time from admission to index surgical procedure, length of stay and lower mortality rate. These findings should be considered when managing call resources within a level one trauma center. However, our study is not meant to devalue the importance of non-trauma trained surgeons providing high quality call coverage outside of level I facilities.
Author Contributions
Parth Patel BS: contributed to data acquisition, reviewing the manuscript draft, has approved of final version of manuscript and is agreeable to be accountable for all aspects of the study.
Katja Brutus BS: contributed to data acquisition, reviewing the manuscript draft, has approved of final version of manuscript and is agreeable to be accountable for all aspects of the study.
Andrew Crain BS: contributed to data analysis, initial manuscript draft, has approved of final version of manuscript and is agreeable to be accountable for all aspects of the study.
Rockey Dahiya MBBS: contributed to data analysis, reviewing the manuscript draft, has approved of final version of manuscript and is agreeable to be accountable for all aspects of the study.
Cameron Foster MD: contributed to study design, initial manuscript draft, has approved of final version of manuscript and is agreeable to be accountable for all aspects of the study.
Firas Madbak, MD: contributed to study design, reviewing/editing the manuscript draft, has approved of final version of manuscript and is agreeable to be accountable for all aspects of the study.
Porter Young MD: contributed to design and conception, reviewing/editing the manuscript draft, has approved of final version of manuscript and is agreeable to be accountable for all aspects of the study.
Disclosures
All of the above authors have no declarations of interest to disclose.
Further Information
No funding was utilized for this project.
This project was presented as a podium presentation at 2025 Eastern Orthopaedic Association annual meeting in Naples, FL, the 2025 Orthopaedic Trauma Association annual meeting as a poster in Phoenix, AZ and the 2025 American College of Surgeons Quality and Safety Conference in San Diego, CA as a poster.