Introduction
Knee osteoarthritis represents the most prevalent form of osteoarthritis, accounting for approximately 50% of all cases.1 This condition is associated with progressive pain, loss of function, and leads to reduced quality of life (QoL).2,3 The initial therapeutic focus is on conservative symptomatic management. However, osteoarthritis (OA) is currently incurable, and as the disease progresses, implantation of a total knee arthroplasty (TKA) is regarded as the gold standard for end-stage OA.2,4
TKA has been identified as a successful therapeutic option for pain management and functional improvement.5 Although TKA is a common procedure with substantial long-term benefits, it has been observed that 10-20% of patients express dissatisfaction with their surgical outcome, even though objective measurement parameters such as radiographic alignment indicate a favourable result.6–8 Research has demonstrated that patient satisfaction after TKA is influenced by numerous factors, including low socioeconomic status, self-efficacy, comorbidities, and lack of functionality.5,9–11 Other studies have shown that dissatisfied patients often have higher levels of pain catastrophizing and depression, which negatively impact their satisfaction with surgical outcome.12,13 Consequently, the integration of Patient-Reported Outcome Measures (PROMs) encompassing psychosocial factors into the assessment of surgical outcomes is recommended4 and can increase patient satisfaction postoperatively.10
However, current research rarely considers patient satisfaction across multiple time points after TKA. Earlier studies observed patient satisfaction at a single point in time, most commonly twelve months postoperatively.11,13,14 The few more recent studies have looked at the development of satisfaction at later points in time. For instance, Clement et al. evaluated the change in patients’ satisfaction levels over five years, revealing a shift in satisfaction among 9% of TKA patients. Specifically, the study found that 6% of patients initially expressed satisfaction after one year but were dissatisfied after five years.15 To the best of the present authors’ knowledge, no comparable studies involving knee patients are currently available. However, a similar study conducted on patients who had undergone a total hip arthroplasty revealed no differences in patient satisfaction at 1.5 years and 13.5 years post-surgery.16 Overall, there is a paucity of studies examining the development of satisfaction with clinical outcomes and/or QoL, especially during varying early postoperative phases after TKA, in which many biopsychosocial changes occur.17,18
Therefore, this study’s objective was to analyze early patient satisfaction changes and associated functional and psychosocial parameters from two to twelve months after TKA.
Materials and Methods
Ethical Considerations
The medical ethics committee of the Carl von Ossietzky Universität Oldenburg approved this study (# 2019-064). Informed consent in written form was obtained from each participant prior to study enrolment. The data were evaluated using pseudonymization. All study procedures were in accordance with the Helsinki Declaration’s ethical principles.
Study design and study population
The present study was conducted as part of the research project FInGK (“Funktionsfähigkeit und Inanspruchnahme von Gesundheitsleistungen bei Patientinnen und Patienten mit Knie-Totalendoprothese”), a prospective cohort study investigating patient outcomes following elective primary or aseptic revision TKA between December 2019 and May 2021 at a university hospital for orthopedics in northwest Germany. The inclusion criteria were as follows: patients had to be aged ≥ 18 years, have a projected life expectancy of more than twelve months, and have sufficient cognitive ability and German language skills to provide informed consent and complete the questionnaires.
Data Collection and Questionnaires
Data were collected via self-reported questionnaires at three time points: preoperatively (t0) at hospital admission, as well as two (t1) and twelve months (t2) postoperatively. The questionnaires included self-assessment components in addition to clinical data extracted from hospital records. Questionnaires encompassed a range of domains, including QoL and health status, function, pain, utilization of physiotherapy and medical rehabilitation, expectations before surgery, socioeconomic factors, social support, and depressive symptoms.
Patient satisfaction with the outcome of TKA was assessed two and twelve months postoperatively using a single-item question “How would you describe the result of your TKA” with a five-level Likert scale from 1 (very good) to 5 (very poor) points.
The Western Ontario and McMaster Universities Osteoarthritis Index (WOMAC Score), a patient-reported outcome measure, was utilized at all three time points to evaluate patients’ self-reported functional status and QoL. This scale, developed explicitly for patients suffering from knee or hip osteoarthritis, has a strong evidence base for measurement.19 It comprises 24 items divided into three subscales: pain (five items), stiffness (two items), and function (17 items). Each item is scored on a scale from 0 (none) to 4 (extreme), with a maximum total score of 96 points. Due to recent recommendations, the reversed WOMAC score (0-100 points) was employed in the current study, where a higher score denotes better functionality.20
Psychological well-being was measured at all three time points with the 5-item WHO Well-Being Index (WHO-5 Score), which was initially published in 1998. It consists of five self-reported items regarding the past two weeks.21 Responses range from 0 (never) to 5 (always) with a maximum score of 25, which is then multiplied by four to yield a percentage value ranging from 0 to 100. Scores between 0 and 28 indicate moderate-to-severe depressive symptoms, 29 to 50 correspond to mild symptoms, and scores above 50 suggest no clinical depressive symptoms. Higher scores thus indicate a better psychological well-being.22
The extent of social support received by patients was assessed at baseline by the Oslo Social Support Scale (OSSS-3), a self-reported instrument23 consisting of three items (number of individuals providing support, the level of interest shown by others, and the potential for obtaining assistance from neighbours). The maximum score is 14, with higher scores indicating greater social support. The level of support was classified as low (≤ 8), medium (9-11), and high (≥ 12).24
Medical records from the index hospitalization included sex, age, body mass index (BMI), and comorbidities classified by the Elixhauser Score. The Elixhauser Score is an instrument that comprises 30 diagnoses, with each having a different weighting and specific point value, where the sum of these points represents the risk of unfavorable health events.25
Further variables were created from patients’ questionnaire responses. These included the items smoking (smoking vs. non-smoking), housing situation (living alone or living with at least one other person), and level of education (low, medium, or high).
Data analyses
Patient satisfaction was divided into satisfaction (including “very good” and “good”) and dissatisfaction (including “medium”, “poor”, and “very poor”). Based on their satisfaction level at follow-up, four groups were formed: Patients who were satisfied at two months (t1) and remained satisfied at twelve months (t2) (Satisfied/Satisfied); not satisfied patients at t1 who became satisfied at t2 (Not-Satisfied/Satisfied); initially satisfied patients at t1 who became dissatisfied at t2 (Satisfied/Not-Satisfied); and the group of not satisfied patients at t1 who remained being not satisfied at t2 (Not-Satisfied/Not-Satisfied).
Study population characteristics were analyzed descriptively (percentages, mean, SD), stratified by patient satisfaction with their TKA outcome after twelve months. In relation to the PROMs (WOMAC and WHO-5), means and 95% confidence intervals (CI) were evaluated. Additionally, p-values for categorical variables were calculated using the Chi-squared test, while for continuous variables the t-test and the analysis of variance (ANOVA) were used. When expected cell counts were < 5, Fisher’s exact test was used. P-values of <0.05 were considered statistically significant.
Statistical analyses were performed using IBM SPSS Statistics, Version 29 (IBM Corp, Armonk, NY, USA).
3. Results
Out of 296 individuals, 283 patients met the inclusion criteria, of which 241 agreed to participate in the study (response 85%). A primary TKA was performed on 214 patients and an aseptic revision TKA on 27 patients. Of these, data were available for 236 patients at two months (t1) (98%) and for 229 at twelve months (t2) (95%). Participants with missing patient satisfaction data at t2 (n = 2) were excluded, yielding a final sample of 227.
Overall, 59.0% of participants were female, mean age was 68.2 years, mean BMI was 32.8, and half had a low level of education (Table 1). In addition, 22.5% lived alone, while 14.1% reported having a low social support system.
Satisfaction at twelve months and baseline characteristics
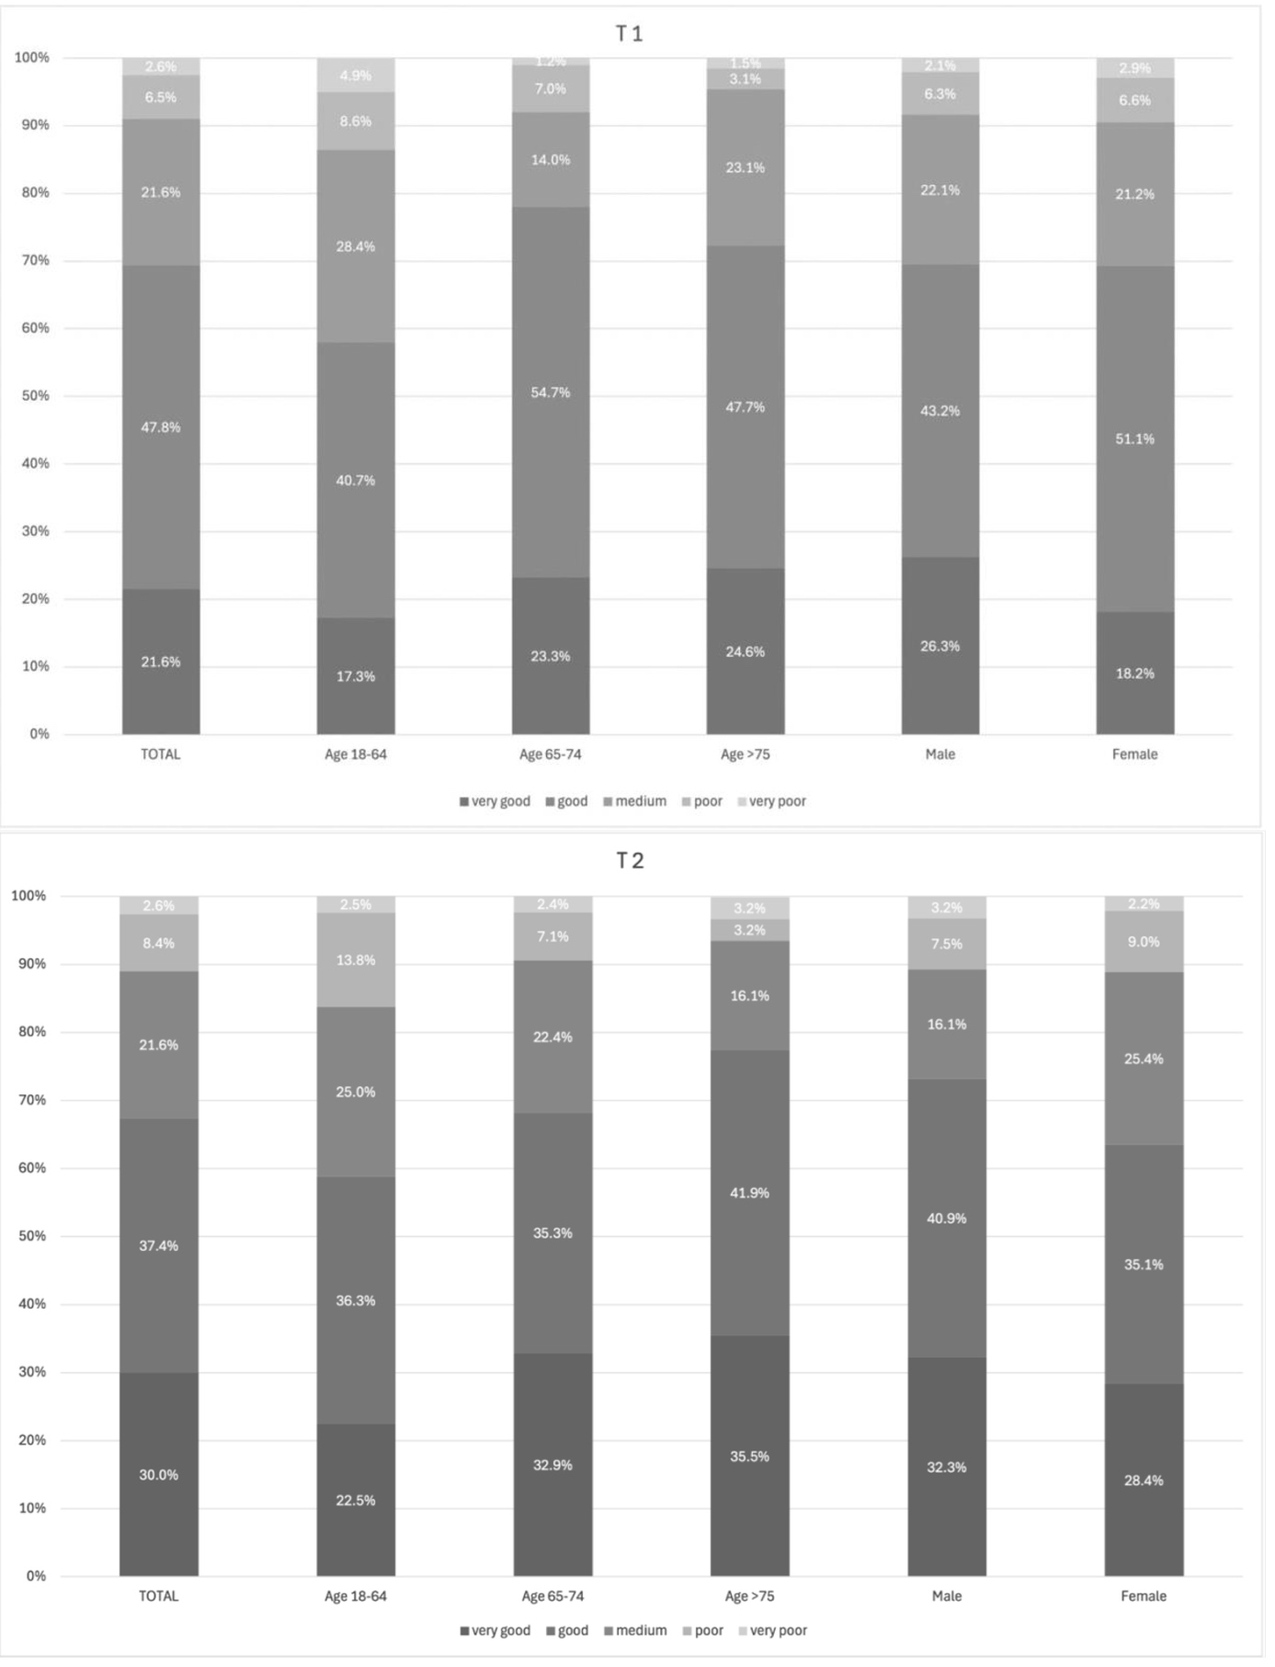
The distribution of patients’ twelve month satisfaction ratings according to the five possible response options (very good to very poor), for the total sample, as well as categorized by age groups and sex, is shown in Figure 1. Overall, satisfaction after twelve months was very good or good in most cases (67.4%). Medium satisfaction was recorded in 21.6% of cases, while 11.0% showed poor or very poor satisfaction. The highest proportion of medium satisfaction was observed in the 18-64 age group (25.0% compared to the other two age groups, 16.1-22.4%). The proportion of female patients exhibiting a medium satisfaction level was found to be 25.4%, in comparison to 16.1% for male patients.
_and_t2_(n_227)_from_very_good_to_very_poor.jpeg)
When comparing patients experiencing dissatisfaction (n=74, 32.6%) with those being satisfied (n=153, 67.4%) twelve months after their TKA, the group of non-satisfied patients was significantly younger (66.5 years vs. 69.1 years; p=0.046), and the proportion of smokers was higher (16.2% vs. 6.5%; p=0.021). Although not statistically significant, the proportion of women in that group was higher than in the group of satisfied patients (66.2% vs. 55.6%; p=0.126). Additionally, a larger percentage of individuals with a low level of education (56.2% vs. 46.7%; p= 0.401), low social support (21.1% vs. 10.7%; p=0.082), and the presence of ≥3 comorbidities (41.9% vs. 32.7%; p=0.217) were found in the non-satisfied group. Housing situation and BMI results were similar between groups (Table 1).
Characteristics of the study population in relation to the change in satisfaction
In relation to the change of satisfaction level between t1 and t2, the total cohort was n=224. The majority (78.1%) of patients exhibited no change in their satisfaction levels between the two time points (t1 and t2) and, thus, were assigned to a Satisfied/Satisfied group (n=129, 57.6%) and a Not-Satisfied/Not-Satisfied group (n=46, 20.5%). In contrast, 21.9% of patients experienced a satisfaction level shift between t1 and t2 and therefore got categorized as Not-Satisfied/Satisfied (n=23, 10.3%) or Satisfied/Not-Satisfied (n=26, 11.6%).
A comparison of the four groups revealed that only a few sociodemographic differences were observed (Supplement Table 1). Age showed significant differences (p=0.012), with the group Not-Satisfied/Not-Satisfied including a notable proportion of patients between the ages of 18-64 years (54.4% as compared to 23.1-34.8% in the other groups). Smoking status was also a significant factor (p=0.013), with the largest proportion of smokers in the Not-Satisfied/Not-Satisfied group (21.7% as compared to 5.4-9.4% in the other groups).
Change of satisfaction related to the WOMAC Score
In total, patients’ functional mobility, as measured by the WOMAC score, reached minimally clinically important improvement from 47.3 preoperatively to 69.0 two months postoperatively (t1) and to 76.5 twelve months after surgery (t2).26 WOMAC score demonstrated no preoperative differences between the four groups, but differences emerged over two and twelve months (Table 2).
The Satisfied/Satisfied group improved their functional abilities at t1 and even showed progression at t2. Conversely, the Not-Satisfied/Not-Satisfied group demonstrated no improvement during postoperative follow-up. A continuous improvement in functional ability, with the greatest change occurring between two and twelve months postoperatively, could be witnessed in the Not-Satisfied/Satisfied group. The Satisfied/Not-Satisfied group initially increased their functional ability two months after surgery, but then experienced stagnation over time. The development of the WOMAC score components over time demonstrated a similar trend with the total score of the satisfaction groups.
Change of satisfaction in relation to the WHO-5 Score
The study population’s mean WHO-5 total score at baseline indicated mild depressive symptoms (43.7) as 35.6% reported suffering from moderate-to-severe depressive symptoms. Two months after surgery, the score had increased (59.1) and further improved towards twelve months follow-up (66.4) (Table 3), indicating a good psychological well-being. Consequently, the relative proportions also diminished over time, with only 19.0% exhibiting moderate-to-severe depressive symptoms at t1 and 10.0% at t2. The WHO-5 score demonstrated a comparable trend to the WOMAC score across the four groups over time. The Satisfied/Satisfied group continuously improved in the follow-up after TKA. Both groups that were not satisfied after two months had a higher proportion of patients with a moderate-to-severe WHO-5 score preoperatively in comparison to the groups who were satisfied after two months (42.2-54.5% vs. 29.0-40.0%). The Not-Satisfied/Not-Satisfied group did not improve and, after twelve months, still had a score indicating lower psychological well-being. Following a twelve month period, one third of patients still exhibited a moderate-to-severe WHO-5 score (33.3% vs. 3.2-8.0% in all other groups). The group Not-Satisfied/Satisfied exhibited no change until two months postoperatively but demonstrated a great improvement between two and twelve months. The WHO-5 score demonstrated an initial increase until two months in the Satisfied/Not-Satisfied group, indicating a positive psychological well-being. However, between two and twelve months, a stagnation of the score was observed.
Discussion
Overall, we found an improvement in functional status and QoL, as well as psychological well-being from preoperative to two and twelve months postoperatively after TKA. However, 32.6% of patients experienced dissatisfaction with their TKA after twelve months and were significantly younger. One-third of them were classified as Satisfied/Not-Satisfied and experienced stagnation in the scores following an initial improvement. The two groups (Not-Satisfied/Satisfied, Not-Satisfied/Not-Satisfied) had lower psychological well-being and functional status preoperatively. Up to two months, both groups had low scores. Yet, while participants from the Not-Satisfied/Satisfied group demonstrated substantial improvements in function and psychological well-being over the twelve month period, this was not observed in the Not-Satisfied/Not-Satisfied group.
Overall postoperative improvement
A notable increase was observed in functional status and related subcategories, including function, pain, stiffness, and QoL total scores, from preoperative to twelve months after TKA. This positive development is consistent with the literature and represents the positive effect of TKA.5,27 Psychological well-being also showed a positive development. It rose from an initial preoperative value, indicating mild depressive symptoms, to a value that already represented good psychological well-being after two months and continued to rise until twelve months. This postoperative improvement was congruent with the results of studies by Jones et al. (2018) and Dong et al. (2024), highlighting the positive impact of a TKA on psychological well-being.28,29 However, the substantial positive impacts on all aspects of functional and psychological health, and ultimately QoL, are only true on average when considering the overall population level. There are large variations between individual patients, underlining the necessity for a more detailed investigation of the various groups and their satisfaction levels over time.
Rollercoaster of satisfaction
We found that postoperative patient satisfaction can vary between two and twelve months. About one third of patients who were dissatisfied twelve months after TKA were, in fact, initially satisfied. The existing literature on the topic of such changes in satisfaction is currently limited, as satisfaction is most often only observed at a single point in time. One of the few existing studies examined hip replacement patients and found no difference in satisfaction levels between 2.5 and 13.5 years postoperatively.16 However, Clement et al. (2018) observed a change in satisfaction in patients after TKA in the period between one and five years, with 6% transitioning from satisfaction after one year to dissatisfaction after five years.15 Particularly the early follow-up after TKA is missing in these studies when biopsychosocial changes may occur. Overall, in our study, 32.6% of patients expressed dissatisfaction after twelve months following TKA, a finding that is higher than the values reported in the literature (8-30%).6,7 One possible explanation for this discrepancy could be that patients who reported medium satisfaction levels were grouped with those expressing dissatisfaction. Yet, even when not including participants reporting medium satisfaction, still every tenth patient was dissatisfied. Furthermore, the type of prosthesis may have influenced satisfaction after TKA, as the Columbus type of prosthesis, in particular, has been documented to exhibit a higher revision rate in comparison to other contemporary knee prosthesis types, as reported in the literature.30 Moreover, the surgical technique may have affected patient satisfaction. All TKA were performed using the tibia-first gap-balancing technique, which is currently considered to be less advantageous than, for example, robotic-assisted techniques.8 Consequently, multicenter studies are indicated, incorporating a range of prosthesis types and surgical techniques in the analysis to provide a more comprehensive picture.
In addition, our findings suggest smoking is a factor significantly influencing patient satisfaction. In line, a systematic review by Yue et al. (2022) revealed an association between smoking and unfavorable Patient Reported Outcomes (PROs) in patients with TKA.31 Smoking can negatively impact the healing process, particularly wound healing, and can also increase the risk of developing a periprosthetic infection.32 Delayed healing potentially results in prolonged dysfunction and pain, which can, in turn, affect satisfaction.
Transition from satisfaction to dissatisfaction
The development of functional status, QoL, and psychological well-being showed a similar pattern in the Satisfied/Not-Satisfied group. Initially, an increase in scores was demonstrated, but then stagnation occurred between two and twelve months. Patients showed favourable outcomes in both PROMS after twelve months, compared to the Not-Satisfied/Not-Satisfied group; however, both groups were dissatisfied. Particularly, the function component attributed to stagnation. This suggests that initial progress often occurs within weeks; however, achieving an optimal range of motion and fully integrating functional training may require extended periods of consistent exercise beyond the immediate rehabilitation phase.33 The decrease in WOMAC function scores may influence the slight decline in psychological well-being between two and twelve months, as a decline in functional abilities and limitations in everyday life can contribute to a deterioration in mood.34,35 It is, therefore, important to consider both the functional and psychological aspects of well-being as well as the effect on each other. Patients with depressive symptoms frequently present with a decline in energy levels, motivation, interest, and fear of movement.36 Enhanced psychological care during the rehabilitation process could be used to support patients and identify coping strategies as well as barriers and facilitators that may contribute to improved functional outcomes.
Dissatisfaction
Both groups of patients who were not satisfied after two months (Not-Satisfied/Satisfied, Not-Satisfied/Not-Satisfied) showed preoperatively lower psychological well-being and function scores compared to Satisfied/Not-Satisfied and Satisfied/Satisfied. Literature suggests inadequate preoperative psychological well-being can be a predictor of postoperative dissatisfaction.5,37 However, the Not-Satisfied/Satisfied group became satisfied between two and twelve months with an improvement in functional and psychological well-being, resulting in similar scores compared to the Satisfied/Satisfied group. A potential explanation for the insufficient improvement at first could be the presence of unrealistically high expectations prior to the surgical intervention. Pre- and post-operative discussions about expectations have been shown to ensure greater postoperative satisfaction after knee replacement.38
Moreover, the Not-Satisfied/Not-Satisfied group showed comparably low preoperatively scores in pain and stiffness, as well as psychological well-being, with still presence of depressive symptoms. Observed poor psychological well-being may be associated with minimal improvements regarding function and pain. A possible explanation for dissatisfaction after TKA could be persistent, chronic pain. Compared to the other groups, the Not-Satisfied/Not-Satisfied group showed the highest levels of pain before undergoing the surgical procedure. Various authors found an association between greater preoperative pain and the development of chronic pain,39 which may have the potential to restrict the rehabilitation process and the patients’ QoL. A preventative approach and perioperative pain management are therefore of essential importance.40 Furthermore, a thorough psychosocial evaluation of the patient’s pain should be conducted as part of the preoperative evaluation process. If OA is indeed not the primary source of pain or if the patient is already chronically sensitized, a multimodal management approach is needed, and TKA may not be a stand-alone.
Another finding of the current study was that the mean age was significantly lower in the Not-Satisfied/Not-Satisfied group, which might have had an impact on patient satisfaction. This finding was in line with previous studies who reported similar results, with younger patients exhibiting greater dissatisfaction compared to older patients in various joint replacements.41,42 This particular patient group has an elevated demand for higher expectations regarding postoperative QoL and physical performance.43 An elevated demand for early return to work, high-impact sports, and knee-demanding leisure activities has been observed among younger patients.43–45 Hence, preoperative advice and postoperative care should be tailored to address individual, distinct needs and expectations of younger patients.
Knowledge to action
This study showed the multifaceted influence on patient satisfaction. As every patient is unique, an individualized and multimodal treatment and follow-up are essential to improve satisfaction levels over time. In addition, it is imperative to educate patients on conservative treatment modalities before surgery, ensuring that these options have been thoroughly explored before proceeding with more invasive procedures, such as a TKA. Given these findings and in line with previous recommendations, surgeons should consider continuous functional and psychological monitoring following TKA.46 These should include comprehensive education about realistic expectations and emphasize the importance of long-term, consistent functional exercise. Different authors demonstrated that patient education and expectation management have an impact on pain reduction and functional improvement in individuals with knee OA.38,47 Furthermore, adequate pain management can lead to further improvement and satisfaction.
Strengths and limitations
This study presents with several strong aspects. The early follow-up points provide valuable insights into the temporal dynamics of satisfaction following TKA. This approach differs from previous studies and offers a unique perspective on the early postoperative course. The comprehensive collection of PROMs across multiple dimensions captures patients’ subjective well-being. In addition, responses were very high (85.0% at t0, 97.9% at t1, and 95.0 at t2), minimizing selection bias. Nevertheless, this study’s findings must also be interpreted in light of some limitations. The sample size calculation was originally designed for a different research question of the FInGK study. Consequently, the sample size for this study was relatively small. This limited the analysis to primarily descriptive statistics, thereby restricting the robustness of the results. Patient satisfaction was assessed using a single-item question, which provides only a general satisfaction statement instead of a more nuanced view across multiple satisfaction dimensions. Medium satisfaction levels were grouped with those expressing dissatisfaction. This approach was taken to ensure that the results were not biased in a positive direction, however this compromises comparability with other studies. The subjective nature of PROMs precludes objective comparison. Data collection at a single supra-regional orthopedic university hospital may limit generalizability to other settings; however, the clinic has a large catchment area of patients (only 31% of study participants resided in the city of the hospital). The paper encompasses both primary and revision procedures. Yet, the number of included revision patients was small and revision procedures solely indicated due to minor aseptic reasons. Finally, TKA was performed using the tibia-first gap-balancing technique, predominantly employing the Columbus prosthesis type. Thus, the results cannot be generalized to other implants or techniques, but further studies are required.
Conclusion
Overall improvements in WOMAC Score and WHO-5 Score were observed in the total study population, but still 33% of patients reported dissatisfaction at twelve months after TKA. We identified a variety of patient groups, each exhibiting distinct levels of satisfaction and biopsychosocial profiles after TKA. It is necessary to consider these trajectories to intervene at an early stage and adapt care according to the patient group. Further studies with larger sample sizes are needed to examine early postoperative outcomes and changes over time after TKA.
List of abbreviations
FInGK Funktionsfähigkeit und Inanspruchnahme von Gesundheitsleistungen bei Patientinnen und Patienten mit Knie-Totalendoprothese
PROM Patient-Reported Outcome Measures
OA Osteoarthritis
OSSS-3 Oslo Social Support Scale
QoL Quality of Life
TKA Total Knee Arthroplasty
WHO-5-Score WHO Well-Being Index
WOMAC-Score Western Ontario and McMaster Universities Osteoarthritis Index
Acknowledgements
The authors would like to thank those who took the time to participate in this study.
Corresponding Author
Lisa Schwarzkopf (L.S.)
Carl von Ossietzky Universität Oldenburg
Department of Health Services Research
26122 Oldenburg, Germany
Phone: +49 171 4951598
Email: lisa.susanne.schwarzkopf@uni-oldenburg.de
Authors’ contributions
LS: conceptualization, investigation, formal analysis, writing – original draft
HJ: methodology, validation, data curation, writing – review and editing
UM: conceptualization, funding acquisition, writing – review and editing
ME: resources, writing – review and editing
FH: conceptualization, methodology, writing – review and editing, supervision, project administration, funding acquisition
GHS: conceptualization, methodology, investigation, writing – review and editing, resources, supervision
All authors read and approved the final manuscript.
Competing interests
The authors declare that they have no competing interests.
Funding
This research was supported by intramural funding from the School of Medicine and Health Sciences of the Carl von Ossietzky Universität Oldenburg (FP 2018-026).