Introduction
The most prevalent severe musculoskeletal birth abnormality in infants is Congenital Talipes Equinovarus (CTEV). It is characterized by adduction, supination, and varus foot fixation, which means pointed downward, slanted inward, and axially rotated outward.1 One to two out of every 1000 live babies have this congenital abnormality,2 with bilateral deformities occurring in about half of cases and unilateral cases being primarily right-sided.3 The deformity can manifest as a single congenital abnormality with an “idiopathic” etiology or as a “syndromic” condition that occurs in combination with other genetically determined characteristics.4
It’s unclear what causes CTEV and how much environmental and genetic influences play a part. Strong evidence suggests that the cause of idiopathic CTEV has a hereditary component. The final question of genetic participation was raised by a more thorough investigation that a five-generation family was effectively implemented, and the autosomal-dominant inheritance pattern was demonstrated.5,6 A family history of idiopathic CTEV is reported in about 24.4% of all isolated cases.7 Even though there are currently no major gene candidates for CTEV, genetics plays a significant impact in its prevalence. Twin studies have shown a higher consanguineous relationship in monozygotic twins (32%) compared to dizygotic twins (2.9%).8 PITX1 and MTHFR were among the most frequently mentioned genes.9,10 The HOX gene family has also seen mutations that are typically observed to cause clubfoot deformity.11 In contrast to genes, which are relatively constant in size and content, the transcriptome, or MicroRNA (miRNA), changes widely and may be affected by several factors.
Several aspects need to be considered when determining MicroRNA, including transcriptome variations that are dependent on age, cell cycle phase, and disorders. This variation results from data showing that the kind and state of the cell affect how RNA is transcribed, or at what level.12 The advantages of miRNA biomarker-based diagnostics include minimally invasive sampling (peripheral blood), high sensitivity through quantitative methods such as RT-qPCR, and the potential to detect preclinical molecular changes non-invasively and monitor them longitudinally.
In this study, Nanostring was used to explore biomarker potential of miRNA in Idiopathic CTEV. This technology was chosen for its ability to directly quantify miRNAs without enzymatic bias. Nevertheless, previous studies have emphasized the importance of validation using RT-qPCR due to potential inter-platform variability.13 The NanoString nCounter has been employed in numerous investigations due to its ability to directly quantify nucleic acids without necessitating an amplification process. It is still unknown how a particular genetic alteration contributes to recurring ICTEV instances, even if this theory was shown to be incorrect for genes linked to ethics.14 We aimed to determine the miRNA profile in ICTEV patient in Indonesian population and explore its potential as biomarker.
Methods
Study design and patient selections
This was a cross-sectional, single-center, exploratory study. Patients were consecutively recruited from the outpatient clinic of the Pediatric Orthopaedic Subdivision, Department of Surgery, Dr. Sardjito General Hospital, Yogyakarta, Indonesia, between July 2021 and January 2024. Ethical approval was obtained from the Ethics Committee of Faculty of Medicine, Public Health and Nursing, Universitas Gadjah Mada (KE/FK/1252/EC/2022). Informed assent was obtained from the parents of all participants prior to enrollment.
Inclusion and exclusion criteria are summarized in Table 1. Based on these criteria, a total of 8 patients were enrolled and subsequently divided into the ICTEV group (n = 4) and the control group (n = 4).
Clinical variables collected included the initial Pirani score, Pirani score at follow-up (at months), number of Ponseti casts applied, whether percutaneous Achilles tenotomy was performed, duration of initial and maintenance foot abduction brace use, as well as weight, height, body mass index (BMI), and pGALS assessment. Sociodemographic variables included maternal age at pregnancy, pregnancy supplement use, household smoking exposure, and economic status.
Based on previous literature, factors such as sex, socioeconomic status, exposure to cigarette smoke, and maternal age at pregnancy have been reported to be associated with the occurrence of CTEV.15–18 Therefore, these variables were identified as potential confounders and were collected for each subject in the present study. All clinical and sociodemographic patient data were collected manually from electronic patient medical record
Sample collection
We collected 2-3 mL of peripheral whole blood from patients who met the eligibility criteria. Venipuncture was performed via the cephalic vein using standard aseptic procedures, and the blood was collected into ethylene diamine tetra acetic acid (EDTA)-coated tubes. Samples were stored at room temperature (15-25 °C) and processed within 2 hours of collection. The blood samples were centrifuged at 2000 rpm at 4 °C for 10 minutes to separate plasma. The plasma samples were then aliquoted and stored at -80 °C, or used immediately for RNA extraction.
RNA extraction
Frozen plasma samples were incubated at 37 °C in a water bath until samples are completely thawed before RNA extraction. Cell-free total RNA, includes miRNAs, was extracted from plasma samples using miRNeasy Serum/Plasma Kit (QIAGEN, Hilden, Germany), strictly following the manufacturer’s protocol.
Briefly, 200 µL of plasma samples were mixed with Buffer RPL and Buffer RPP, then incubated at room temperature to promote efficient protein denaturation. Samples were then centrifuged to remove precipitates, yielding clear supernatant. The resulting supernatant was mixed with isopropanol to facilitate nucleic acid binding and subsequently transferred to the RNeasy UCP MinElute spin column. After sequential washes with Buffer RWT, Buffer RPE, and 80% ethanol to remove residual proteins, salts, and contaminants, RNA was eluted in 20 µL of RNase-free water. The purified RNA was either used immediately or stored at –80 °C until use for further analysis.
The concentration and purity of the extracted RNA were quantified using TapeStation (Agilent Technologies, USA) and NanoDrop™ spectrophotometer (Thermo Fisher Scientific, USA), respectively. The integrity of RNAs was assessed to ensure suitability for downstream applications. Acceptable concentrations of total RNA were established at minimum of 100 ng, with preferred values of 1.6 for the A280/A260 ratio and 1.8 for the A260/A230 ratio.
miRNA expression profiling using NanoString nCounter
For miRNA expression profiling, the nCounter® Human v3 miRNA Panel (NanoString Technologies, Seattle, WA, USA) was used. This platform enables direct digital detection of approximately 800 human miRNAs without the need for reverse transcription or amplification, thereby reducing technical bias and ensures more accurate and reproducible measurement.
Briefly, the workflow of miRNA sample preparation involved three sequential steps: multiplexed annealing of unique DNA tags to the target miRNAs, enzymatic ligation to generate tag–miRNA complexes, and purification to remove excess unligated tags. nCounter miRNA assays require purified total RNA as input material, in which the recommended concentration is ≥33 ng/μL. For each reaction, 3 μL of purified total RNA was combined with an annealing master mix containing nCounter Tag Reagents, Annealing Buffer, and diluted miRNA assay controls. Annealing was performed in a thermal cycler at 94 °C for 1 min, 65 °C for 2 min, 45 °C for 10 min, and held at 48 °C. Ligation was carried out by adding a PEG-based ligation mix followed by ligase enzyme directly at 48 °C, and samples were incubated through a temperature gradient (48 °C, 3 min ― 47 °C, 3 min ― 46 °C, 3 min ― 45 °C, 5 min ― 65 °C, 10 min ― 4 °C on hold) to ensure efficient adapter ligation. Following ligation, each reaction was treated with a clean-up enzyme and subjected to a purification step consisting of 1 h incubation at 37 °C, followed by heat inactivation at 70 °C for 10 min. The purified ligated products were diluted in nuclease-free water to a final volume of 40 µL.
Those tagged miRNA samples were then proceeded for hybridization with the nCounter® Human v3 miRNA CodeSet (NanoString Technologies, Seattle, WA, USA). Hybridization process was carried out according to the manufacturer’s instructions. Briefly, each reaction consisted of 20 µL hybridization master mix (Reporter CodeSet and Hybridization Buffer), 5 µL of purified tagged miRNA sample, and 5 µL Capture ProbeSet, yielding a final volume of 30 µL. Prior to hybridization, samples were denatured at 85 °C for 5 min and immediately cooled on ice. Hybridization was carried out in a thermal cycler at 65 °C with a heated lid at 70 °C for 16–30 h, with an optimal incubation time of 20–22 h. Following hybridization, reactions were held at 65 °C until processing in the nCounter Prep Station.
Lastly, the cartridges were scanned on the nCounter Digital Analyzer to generate raw count data. The Digital Analyzer uses multiple Field of View (FOVs) in the process of counting barcodes. At least 75% of FOVs should be successfully counted to obtain robust data. Raw counts for each target miRNA, as well as positive and negative control probes, were exported as RCC dan RLF files for downstream data processing.
Analysis of miRNA expression profile
Raw miRNA expression profiles were uploaded and analyzed using ROSALIND® (OnRamp Bioinformatics, San Diego, CA, USA), a cloud-based analysis platform for NanoString data. ROSALIND automatically performed standard quality control, background correction, positive control normalization, and normalization to housekeeping genes following NanoString-recommended best practices.
Normalization factors were calculated to adjust for differences in analyte abundance and quality across samples, thereby accounting for input variance and potential RNA degradation effects. All normalization factors were within the acceptable range of 0.1–10, indicating no samples required exclusion.
Differential expression analysis was performed within ROSALIND using a generalized linear model framework, with p-values adjusted for multiple testing using the Benjamini–Hochberg method to control the false discovery rate (FDR). ROSALIND also generated fold-change estimates, volcano plots, and heatmaps as part of its integrated analysis workflow.
Prediction of potential putative gene
Differentially expressed miRNAs identified from the NanoString analysis were subjected to further exploration for their putative target genes using the multiMiR R package (version 1.30.0). This package integrates data from 14 curated external databases containing both experimentally validated interactions and computationally predicted interactions.19 Analyses were restricted to Homo sapiens entries. To identify genes targeted by more than one dysregulated miRNA, lists of predicted targets were compared in R. Overlaps among target gene sets were visualized using Venn diagrams generated with the VennDiagram R package. Prior to plotting, all gene vectors were cleaned to remove missing values (NA) and duplicates, ensuring accurate representation of shared targets. Genes located in the overlapping regions, representing shared targets among the selected miRNAs, were subsequently selected for functional enrichment analyses.
Enrichment analysis
Functional enrichment analyses, including Gene Ontology (GO) and pathway enrichment, were performed on the resulting putative target genes using clusterProfiler R package. Enriched terms were visualized using enrichplot R package.
Statistical analysis
Sample size was calculated a priori using a standard formula for comparison of two means, based on an expected difference in mean expression levels and variance derived from previous data. This calculation resulted in a minimum required sample size of four samples per group.
Clinical and socioeconomic variables were analyzed using SPSS software (version 27; IBM Corp., Armonk, NY, USA). Continuous variables were summarized as mean ± standard deviation (SD), while categorical variables were expressed as frequencies and percentages. Between-group comparisons of baseline characteristics were performed using independent-samples t-tests or Mann–Whitney U tests, depending on data distribution. Categorical variables were compared using Chi-square or Fisher’s exact tests, as appropriate.
Potential confounding variables (sex, socioeconomic status, exposure to cigarette smoke, and maternal age) were descriptively compared between groups to assess baseline balance. Due to the limited sample size, no multivariable regression analysis was performed.
A p-value <0.05 was considered statistically significant.
Results
Subject characteristics
In total, eight patients met the eligibility criteria and were included in the study, with peripheral blood samples collected from all participants. In the non-recurrent idiopathic CTEV cohort, the mean baseline Pirani scores were elevated on both the right (5.37 ± 0.48) and left feet (4.25 ± 2.87), but improved to 0 at follow-up, indicating complete clinical correction. The mean number of Ponseti casts required was 5.75 ± 0.5 times, with 25% of patients undergoing percutaneous Achilles tenotomy. Adherence to the bracing protocol was consistent, with mean daily brace usage of 23 hours during the initial phase and 16 hours during the maintenance phase. The mean maternal age during pregnancy was slightly higher in the non-recurrent group compared to controls, while prenatal supplement intake was reported by all mothers in both groups. A positive household smoking exposure was observed in 75% of the non-recurrent group and 100% of controls. Although the control group reported a higher mean household income, anthropometric parameters (body weight, height, and BMI) were comparable between groups. Functional assessment using the pGALS screening tool demonstrated no pain, no difficulty in dressing or ambulation, and normal movement patterns in all participants Table 2.
Differential Expression of miRNA
To identify differentially expressed miRNAs between groups, the data generated from ROSALIND® were analyzed using a two-tailed Student’s t-test to compute fold changes and corresponding p-values for each comparison defined during the experimental setup. To address the issue of multiple testing, false discovery rate (FDR) adjustments were applied using the Benjamini–Hochberg procedure. miRNAs with absolute fold change ≥1.5 and p-value ≤0.05 were considered putative differentially expressed.
Given the exploratory nature of this analysis and the absence of widespread statistical significance after FDR correction, the following miRNA findings should be interpreted with caution.
The lists of putative upregulated and downregulated miRNAs (p <0.05), sorted by fold change, have shown in Table 3 and Table 4, respectively.
Putative upregulated circulating miRNAs (p <0.05) identified in non-recurrent idiopathic CTEV compared with controls, ranked by fold change. Only miRNAs meeting the predefined significance threshold are shown (ROSALIND platform).


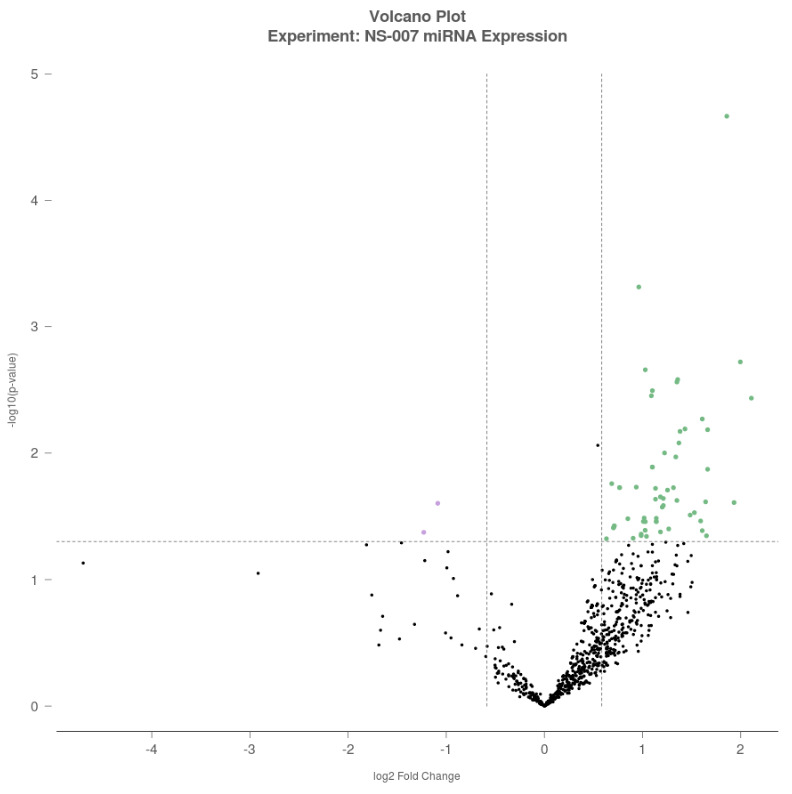
When compared with control group, two miRNAs were found to be downregulated in non-recurrent idiopathic CTEV group, namely hsa-miR-548d-5p with a fold change of –2.34 (p = 0.042) and hsa-miR-26a-5p with a fold change of –2.12 (p = 0.025). In contrast, top 5 miRNAs were upregulated in non-recurrent idiopathic CTEV group relative to controls, with the largest fold changes observed in the following sequence: hsa-miR-584-5p, hsa-miR-125a-3p, has-miR-553, hsa-miR-6724-5p, and hsa-miR-561-5p.
A volcano plot was generated to visualize differential expression, with log₂-Fold Change (FC) plotted on the x-axis and –log₁₀(p-value) on the y-axis. Each dot represents a miRNA, with green dots indicating upregulated miRNAs (log₂FC >0.5), purple dots indicating downregulated miRNAs (log₂FC <–0.5), and black dots representing miRNAs that did not meet the significance threshold (Figure 1).
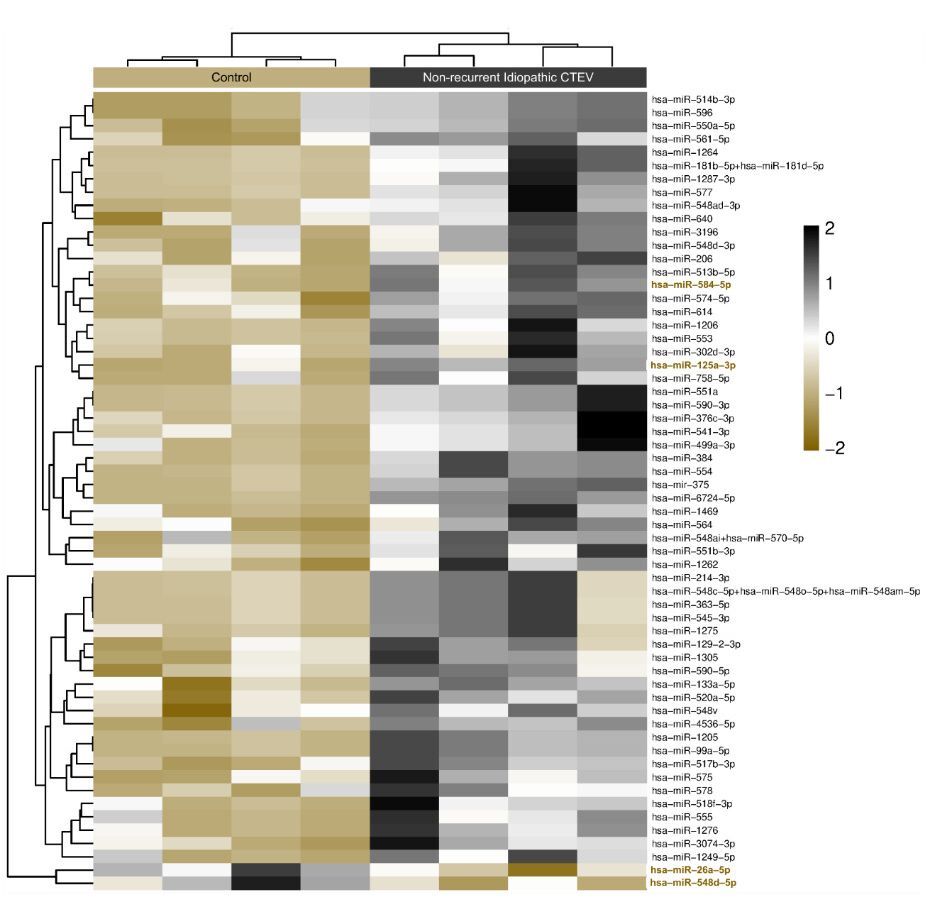
For clustering analysis, the Partitioning Around Medoids (PAM) algorithm was employed using the fpc R package. PAM clustering accounts for both the direction and magnitude of expression change, grouping miRNAs with similar expression profiles. The resulting heatmap provides a visual overview of how expression patterns differentiate the non-recurrent ICTEV group and control group, and also highlights potential cooperative behaviour of miRNA sets within shared signaling pathways relevant to CTEV recurrence and deformity (Figure 2). Together, these findings indicate that distinct circulating miRNA signatures may discriminate non-recurrent CTEV patients from healthy controls.
From the putative dysregulated miRNAs, four with notable fold changes: hsa-miR-584-5p, hsa-miR-125a-3p, hsa-miR-548d-5p, and hsa-miR-26a-5p, were selected for bioinformatics analysis, including target gene prediction and pathway enrichment.
Identification of validated gene targets
Using the multiMiR R package, target genes of the four dysregulated miRNAs (hsa-miR-584-5p, hsa-miR-125a-3p, hsa-miR-548d-5p, and hsa-miR-26a-5p) were identified. The search retrieved experimentally validated interactions from three databases (miRecords, miRTarBase, and TarBase), yielding a comprehensive list of putative targets. This dataset formed the basis for subsequent functional enrichment and network analyses.
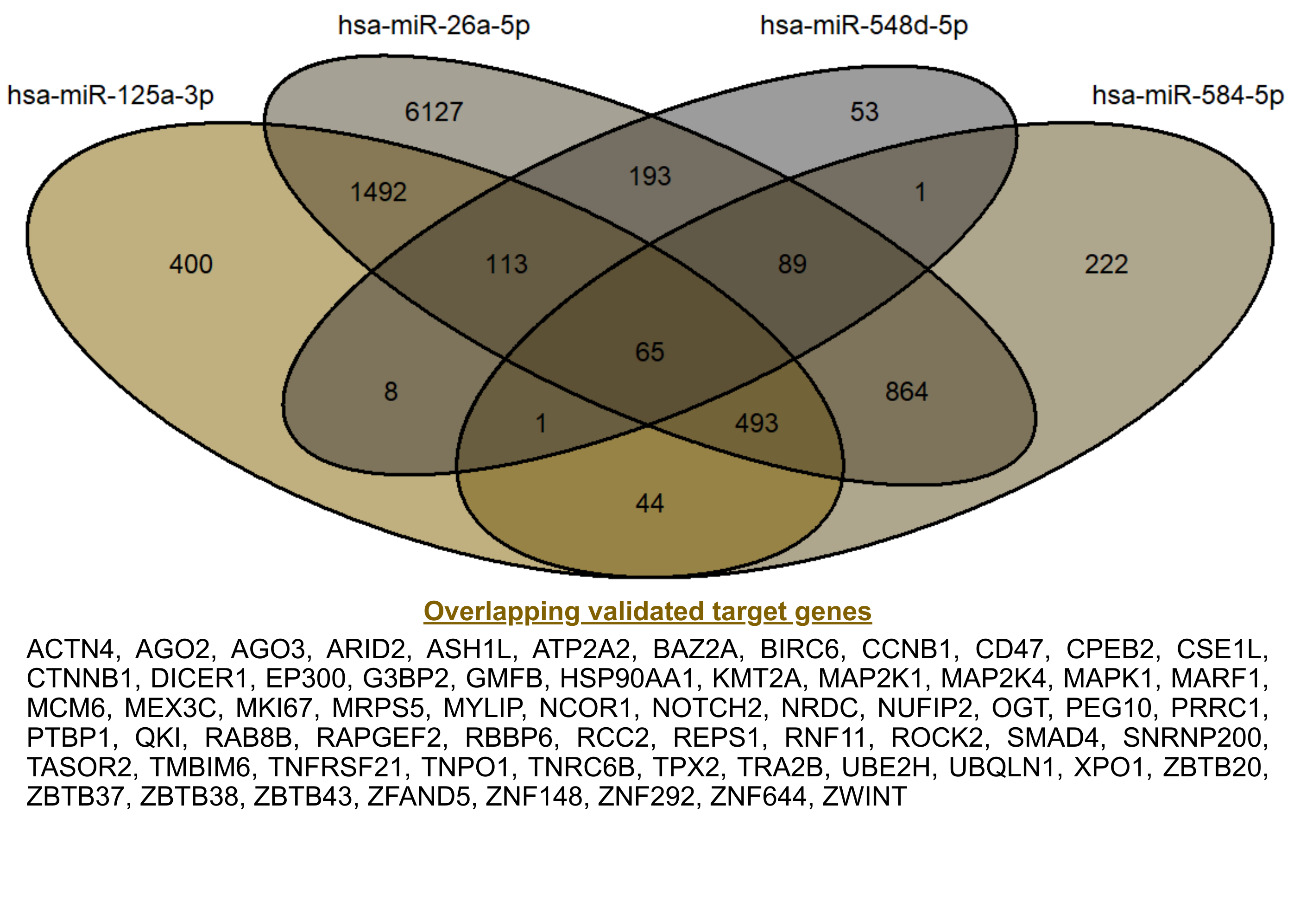
Validated target genes of the four miRNAs were retrieved using the multiMiR R package. The search identified 9,436 targets for hsa-miR-26a-5p, 1,779 for hsa-miR-584-5p, 2,616 for hsa-miR-125a-3p, and 523 for hsa-miR-548d-5p. Notably, the exceptionally large number of experimentally supported targets for hsa-miR-26a-5p is consistent with its role as a broadly expressed and stable reference miRNA in expression studies.20 Integration of validated target genes from the four dysregulated miRNAs revealed 65 overlapping targets, as shown in Figure 3. These shared genes were considered high-confidence candidates, as they represent convergent regulatory signals across multiple miRNAs. These gene sets were subsequently used for functional enrichment and network analyses.

Enrichment analysis
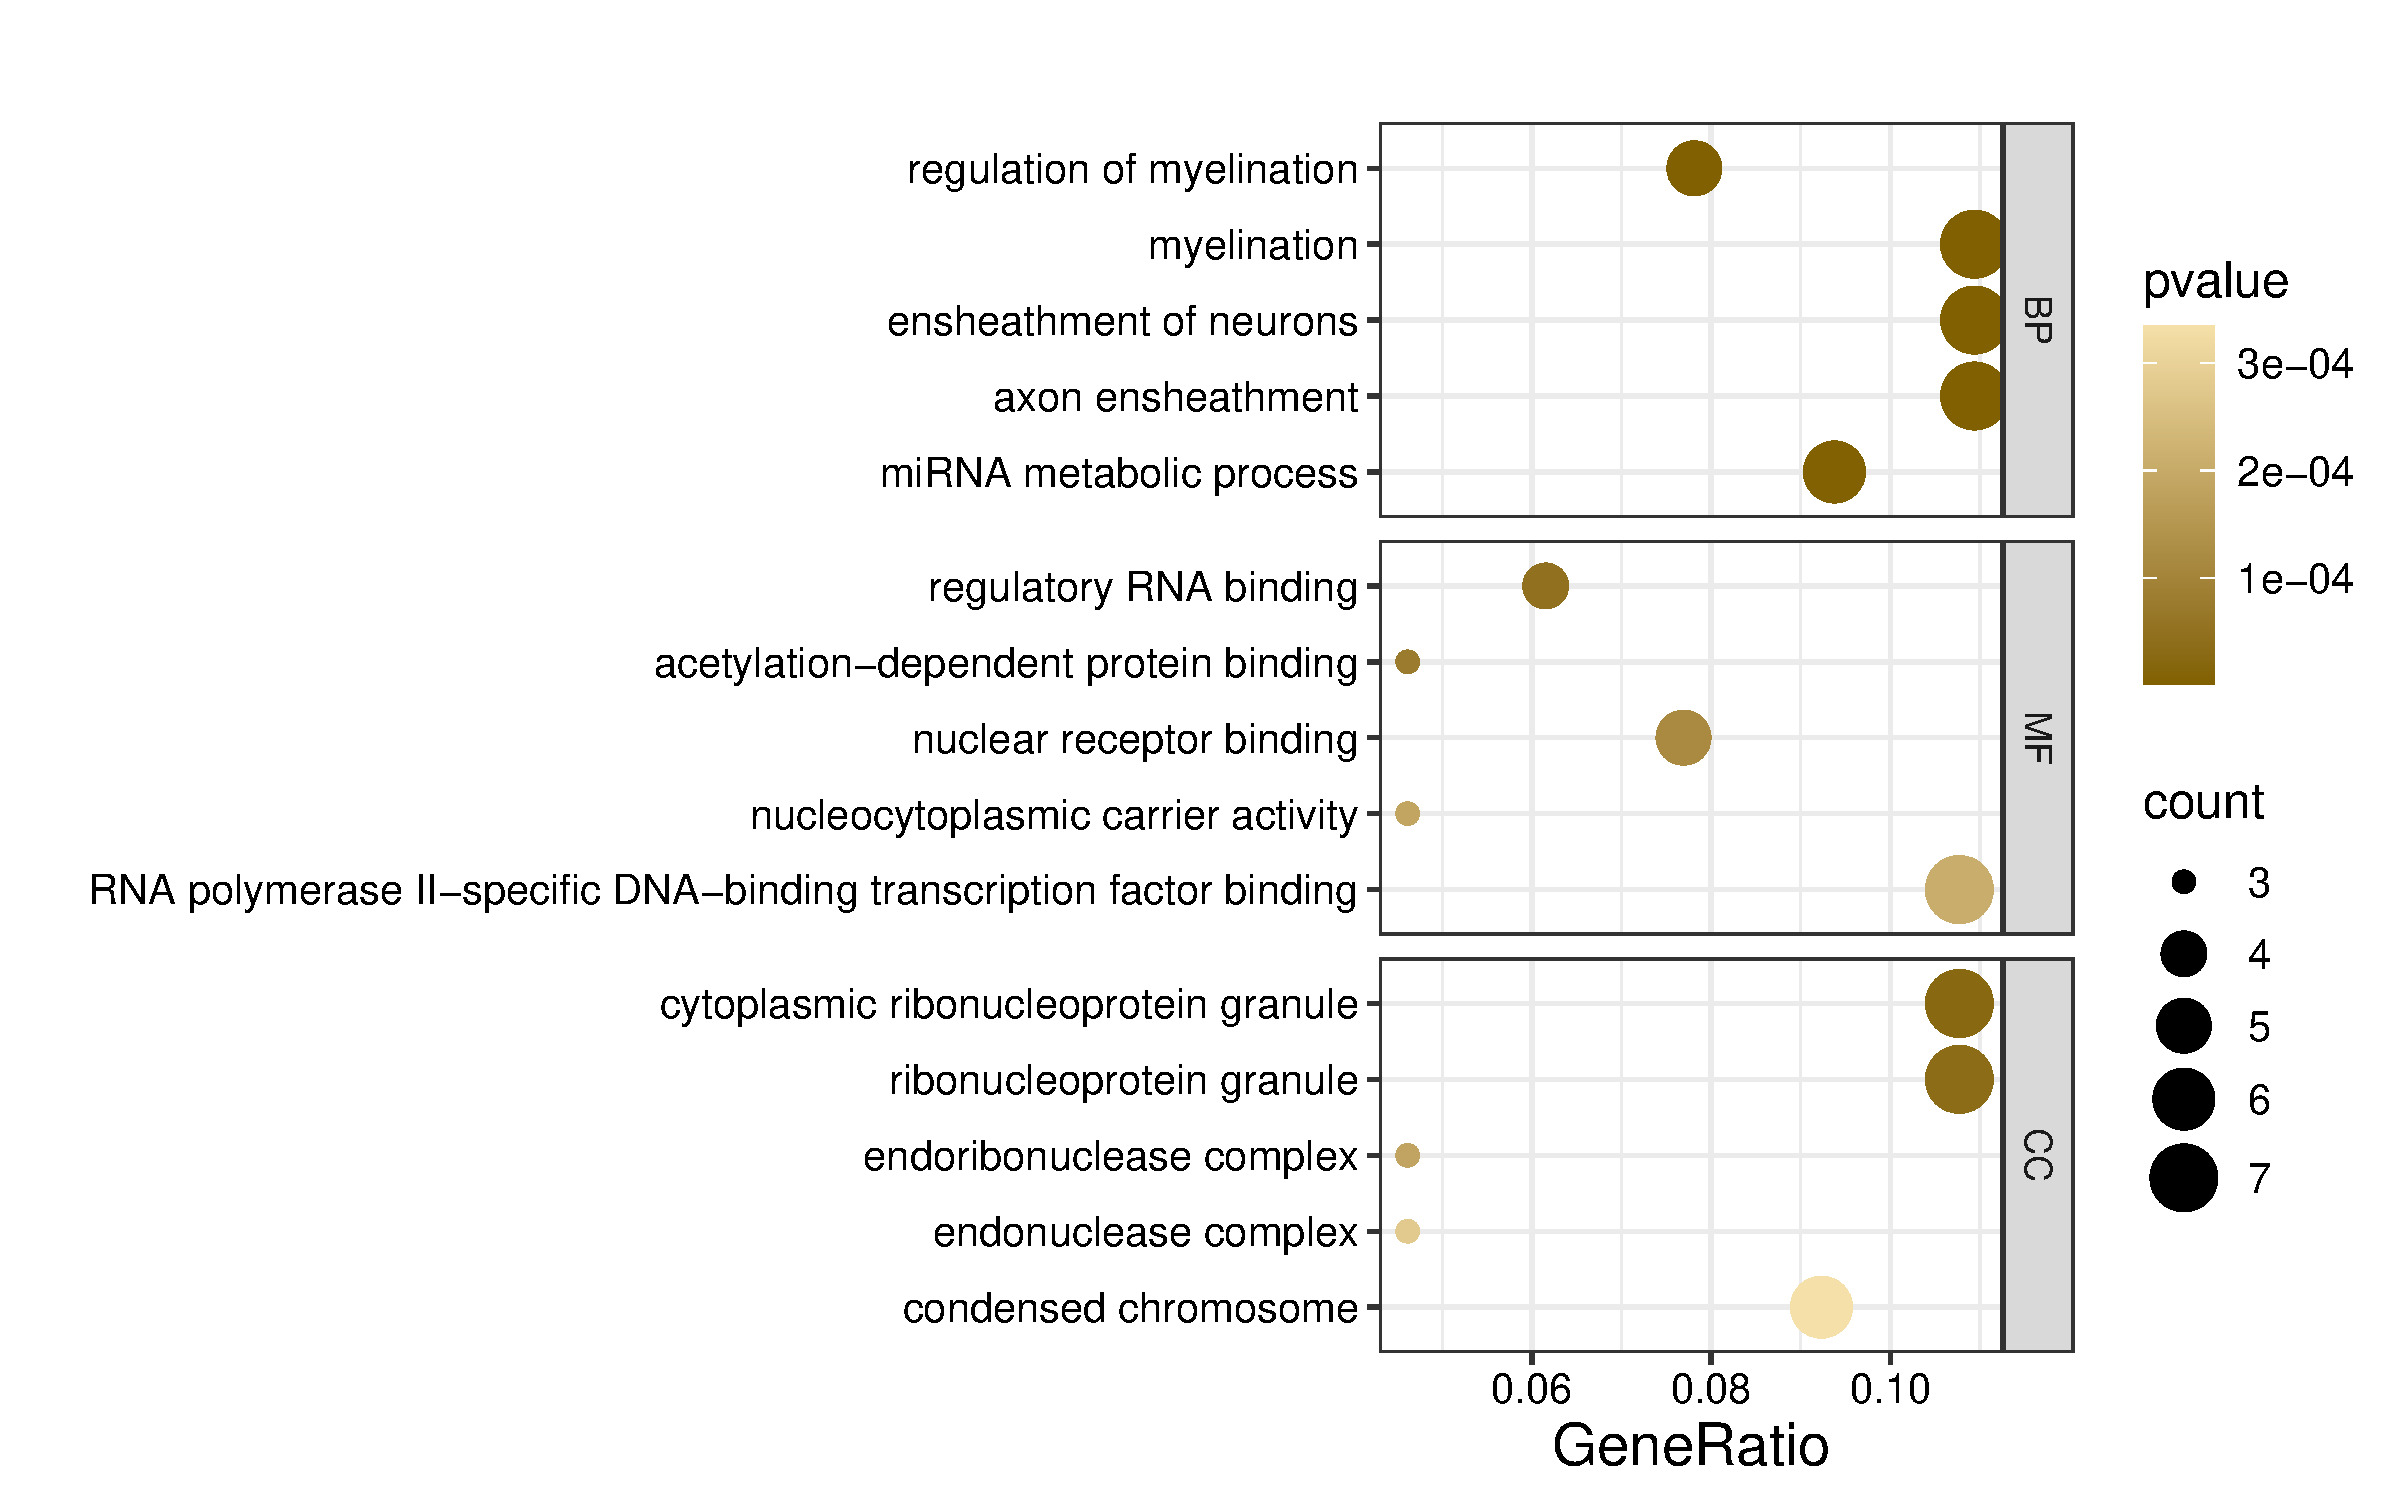
To explore the shared functions of the four dysregulated miRNAs and their potential roles in gene expression regulation, the 65 putative target genes (Figure 3) were analyzed using the clusterProfiler R package. Functional enrichment analysis based on Gene Ontology (GO) categorized these genes into biological process (BP), molecular function (MF), and cellular component (CC) terms, with the top five terms selected based on p-values (Figure 4). GO annotation analysis indicated that target mRNAs were primarily involved in BP terms such as regulation of myelination, myelination, ensheathment of neurons, and axon ensheathment, suggesting a role of these miRNAs in neural development and maintenance. Additionally, miRNA metabolic process was enriched, consistent with the post-transcriptional regulatory functions of miRNAs.
CC analysis showed strong enrichment for cytoplasmic ribonucleoprotein granule, ribonucleoprotein granule, and endonuclease complex, pointing toward a localization of target gene products in RNA processing and degradation compartments. Regarding the MF terms, significant enrichment was observed for regulatory RNA binding, acetylation-dependent protein binding, and nuclear receptor binding, indicating that the target genes of these miRNAs may participate in transcriptional regulation and chromatin remodeling.

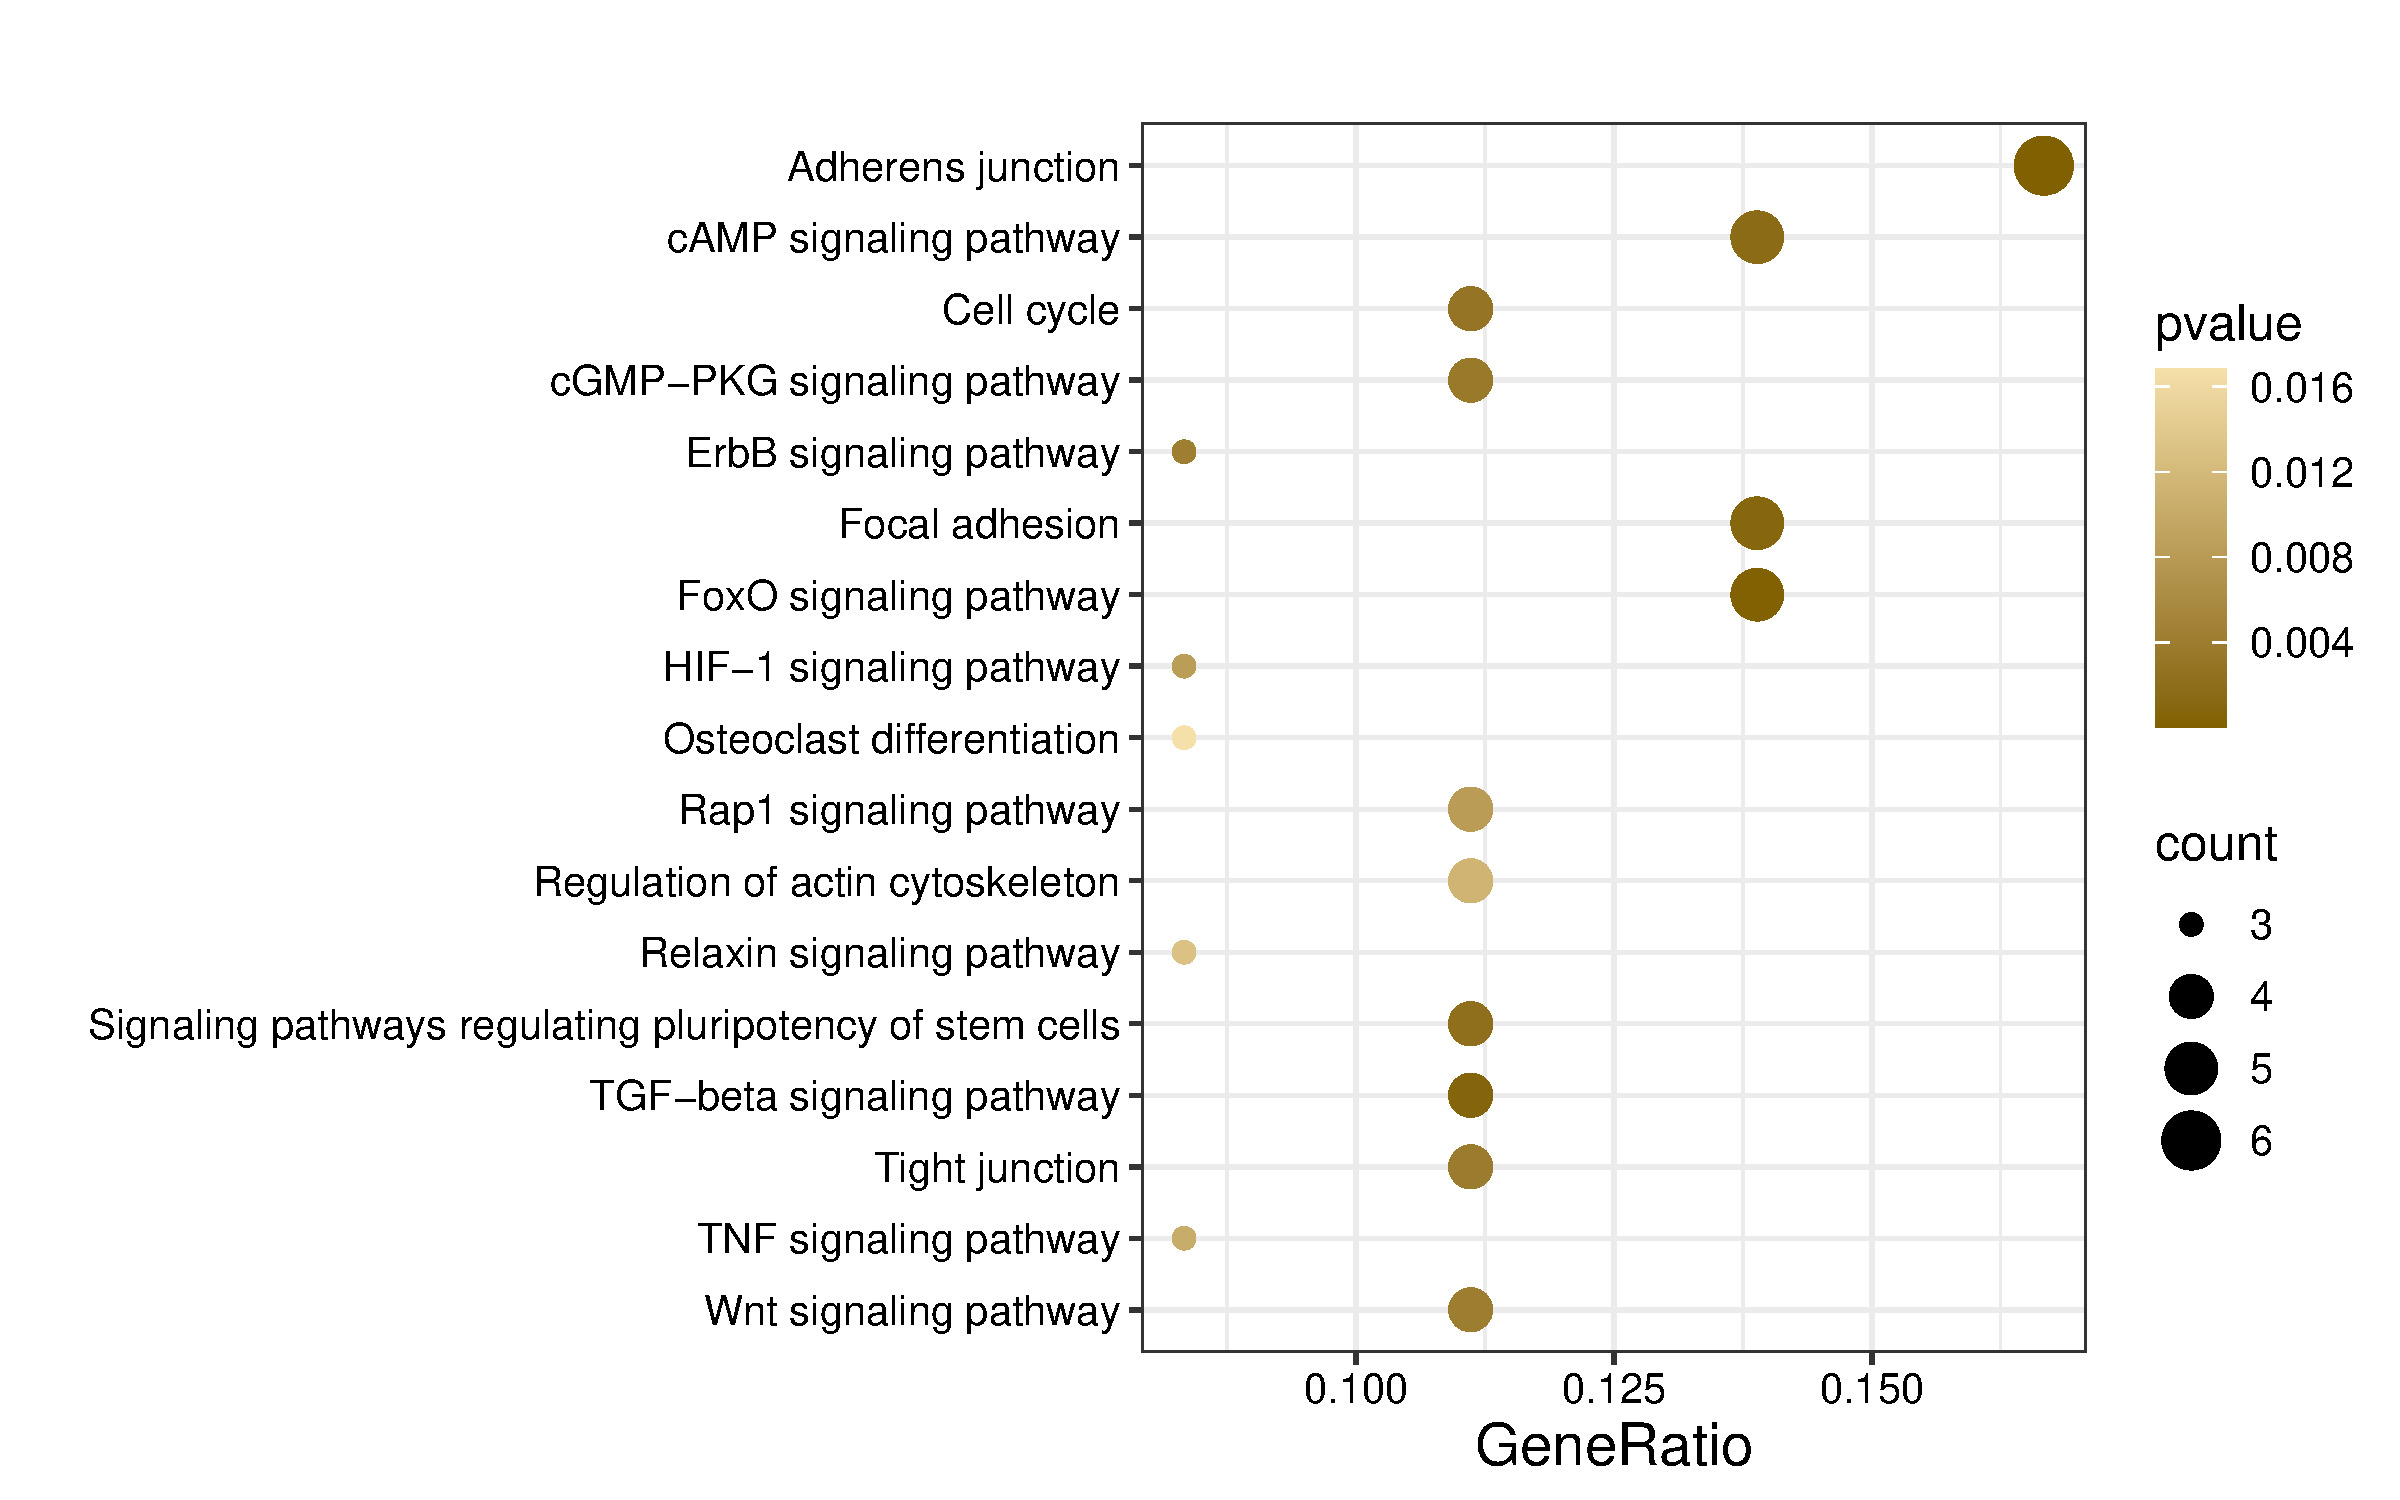
Kyoto Encyclopedia of Genes and Genomes (KEGG) pathway enrichment was performed using the enrichKEGG function for human pathways (organism = “hsa”), applying the same multiple testing correction and significance cutoff. KEGG pathway analysis identified 61 pathways, of which those predicted to be relevant to musculoskeletal, neurodevelopment, and angiogenesis are shown in Figure 5 and Table 5.

Discussion
Idiopathic CTEV is more common than syndromic CTEV, although the exact cause remains unclear. According to a systematic review by Muhammad,21 the HOX, CASP and COL gene families are associated with CTEV. The Homeobox (HOX) gene family Idiopathic CTEV is more common than syndromic CTEV, although the exact cause. The 39 HOX genes found in humans are grouped into subgroups linked to the limbs, gastrointestinal, urogenital, and axial skeleton.21 Gene expression at the posttranscriptional level is regulated by a broad group of microRNAs (miRNAs), which are small noncoding RNAs. Approximately 1000 miRNAs are known to exist inside the human genome, and they could influence numerous genes that code for proteins.22 Initial transcription of DNA sequences results in primary miRNAs, which are subsequently transformed into miRNA precursors and, eventually, mature miRNAs, to produce the majority of miRNAs. Most of the time, miRNAs cause translational repression and mRNA degradation via engaging with target mRNAs’ 3′ untranslated region (3′ UTR). However, miRNAs have also been reported to interact with other regions, including the coding sequence, gene promoters, and the 5′ UTR.23
Among the identified miRNAs, miR-584-5p and miR-125a-3p exhibited the highest fold changes and were therefore selected for further analysis. miR-584-5p expression was markedly increased in patients with idiopathic CTEV, suggesting its potential role as a biomarker for this condition. Previous studies have reported that overexpression of miR-584-5p increases apoptosis while inhibiting osteosarcoma cell motility, invasion, and proliferation
Functional enrichment analysis indicated that miR-584-5p may regulate several signaling pathways, including adherens junction, axon guidance, cytoskeleton organization in muscle cells, ECM–receptor interaction, focal adhesion, neuroactive ligand–receptor interaction, Hedgehog signaling, Hippo signaling, MAPK signaling, PI3K–Akt signaling, Ras signaling, regulation of the actin cytoskeleton, Relaxin signaling, TGF-β signaling, and Wnt signaling pathway. Most of these pathways play a role in neurogenesis, musculoskeletal development, and angiogenesis.
Adherens junctions are essential for angiogenesis, neuronal development, and musculoskeletal function by mediating cell-cell adhesion and signal transduction. Adherens junctions support endothelial cell migration, growth, and differentiation, and maintain the integrity, development, and repair of muscle and connective tissue.24–27 The cytoskeleton in muscle cells plays a crucial role in muscle contraction, musculoskeletal integrity, and myogenesis. It facilitates structural support, cell movement, signal transduction, myoblast fusion, myofibril assembly, and the formation of muscle fiber architecture.28
Previous research stated that miRNA 584-5p has not been recognized as related to clubfoot and limb deformity. But it may interfere from actin cytoskeleton and TGF-β pathway.29 The TGF-β signaling pathway plays a crucial role in the nervous, musculoskeletal, and vascular systems. In the nervous system, TGF-β regulates neurogenesis, dendrite growth, spine formation, and impulse transmission at synapses.30,31 In musculoskeletal tissues, TGF-β controls muscle growth, repair, and fibrosis, as well as bone remodeling and tendon healing.32–34 Several genes involved in the TGF-β pathway are known to exhibit increased expression in syndromic clubfoot. Impaired TGF-β signaling in clubfoot tissue leads to fibrosis and changes in ECM composition. Mutations in TGF-β pathway components or ECM proteins are frequently found in syndromic clubfoot. This association is reinforced by the involvement of Filamin B (FLNB), which interacts with the cytoskeleton, ECM, and TGF-β signaling pathways.35
Similarly, miRNA 125a-3p has not been previously recognized as related to muscle deformity, but we suggest this microRNA is related to rheumatoid arthritis that may contribute to the pathogenesis of ICTEV. By targeting MAST3, overexpression of miR 125a-3p may deactivate several pathways called the Wnt/β-catenin and NF-κB, thereby reducing the response to inflammation and cell proliferation of fibroblast-like synovial cells and RA tissues in rheumatoid arthritis (RA-FLS).36
miRNA 26a-5p was elevated over muscle-skeletal differentiation, and excessive expression encouraged the development of myoblasts. At the same time, miR-26a was inhibited by controlling Smad1 and Smad4. In RA-FLS cells transfected with miR-26a-5p inhibitor, cell proliferation rate peaked on day 2, indicating that downregulation of miR-26a-5p inhibits cell proliferation. When combined, their findings indicated that miR-26a-5p stimulates RA-FLS cell cycle progression and proliferation. While suppression of miR-26a-5p resulted in complete apoptosis, overexpression of miR-26a-5p also slowed the rate of apoptosis in RA-FLS. In contrast, RA-FLS showed decreased cell proliferation, invasion, and apoptosis resistance along with down-regulated miR-26a-5p. While overexpression of miR-26a-5p escalated these traits.37
Clubfoot causes stiffness as a result of the contraction of soft tissues. It is characterized by the high expression of extracellular matrix proteins such as versican, tenascin-C, collagen types III, V, and VI, asporin, and TGF-β induced protein.38,39 Additionally, ECM plays a part in the movement of cells, proliferation, and differentiation. TGF-β signaling is regulated in part by extracellular matrix binding.4,40 The etiopathogenetic process of clubfoot involved immunological responses and abnormalities in the extracellular matrix.41 By controlling the actomyosin complex, miRNAs are essential for many biological activities in different tissues [75]. Clubfoot has only been linked to the gene encoding Filamin B (FLNB), which is necessary for actin cytoskeletal function.42 An actin-binding protein called FLNB creates a dynamic structure by crosslinking actin cytoskeleton filaments.43
This finding is quite consistent with the results obtained that there is downregulation of the miRNA gene family, namely miRNA 26a-5p and miRNA 548d-5p, in patients with idiopathic CTEV through the involvement of the TGF signaling pathway and the actin cytoskeleton pathway. Due to the varying findings from our study and the literature, a definitive theory remains inconclusive. However, the observed downregulation of miRNA 26a-5p and miRNA 548d-5p in our idiopathic CTEV patients provides valuable insights. Further tests could be conducted to quantify, validate, and explore the potential of miRNA 26a-5p and miRNA 548d-5p as biomarkers for idiopathic CTEV patients. These findings should be interpreted as preliminary and hypothesis-generating rather than as definitive clinical evidence.
This exploratory study bears several limitations. Although the sample size was determined a priori using a conventional formula for comparing two means, more conservative estimation approaches (e.g., G*Power) suggest that a larger sample size may be required. As a result, the modest sample size may have limited statistical power to detect modest between-group differences, increasing the risk of type II error, particularly in analyses involving correction for multiple testing. In addition, the small sample size precluded multivariable regression analyses; therefore, potential confounders were evaluated descriptively rather than through adjusted models. These limitations may restrict the generalizability of the findings, which should be interpreted cautiously as hypothesis-generating. Future studies with larger sample sizes are warranted to enable adequately powered multivariable analyses and improve generalizability.
Conclusion
Based on this exploratory study, MiR-584-5p, MiR-125a-3p, MiR-26a-5p, and MiR-548d-5p have been identified as potential biomarkers for detecting ICTEV. To advance the development of these biomarkers, it is important to validate these miRNA candidates through expression testing and further analysis of their individual roles in regulating ICTEV-related genes.
Author contributions
H.M (Conceptualization, Writing-Original Draft, Validation, Investigation), S.M.H: (Validation, Methodology, Writing-Review & editing, Supervision), R.M: (Visualization, Resources, Methodology, Supervision), D.W.S: (Writing-Original Draft, Resources, Validation), F.A.Y: (Resources, Writing-Original Draft, Visualization, Validation), A.F.H (Validation, Methodology, Writing-Review & editing, Supervision), A.I.T: (Writing-Original Draft, Resources, Validation), Q.J.W: (Resources, Writing-Original Draft, Visualization, Validation).
Ethical approval
This research has received approval from the Ethics Committee of the Faculty of Medicine, Universitas Gadjah Mada (UGM), Yogyakarta, with ethical clearance approval letter number KE/FK/1252/EC/2022.
Consent for publications
Written informed consent was obtained from the patient for publication of this case report and any accompanying images. A copy of the written consent is available for review by the Editor-in-Chief of this journal.
Availability of supporting data
Supporting data will be available upon reasonable request.
Competing interest
The authors declare no conflict of interest.
Funding
This research received no external funding.
Declaration of artificial intelligence use
This study used artificial intelligence (AI) tools and methodologies in the manuscript writing support. AI-based language models, such as ChatGPT and DeepSeek, were employed for language refinement, summarizing findings in a concise manner, and technical writing assistance. We confirm that all AI-assisted processes were critically reviewed by the authors to ensure the integrity and reliability of the results. The final decisions and interpretations presented in this article were solely made by the authors.