
Introduction
Osteoarthritis
Osteoarthritis (OA) is the most common form of arthritis in the world and can be classified into primary (most common) and secondary OA.1 OA classically presents as loss of function and joint pain.1 Some important risk factors include increased age, female gender, obesity, personal anatomical factors, muscle weakness, and joint injury generally due to occupation or sports activities.1 About 3.3 to 3.6% of the population is affected by OA, globally.1 On the financial side of this condition, in 2011, there were around 1 million hospitalizations for OA, with a total cost of nearly $15 billion, making it the second most expensive disease in the United States.1
Rheumatoid Arthritis
Rheumatoid arthritis (RA) is a systemic autoimmune disease characterized by inflammatory arthritis with extra-articular involvement.2 The joint inflammation leads to joint destruction with loss of cartilage and bone erosions over time.2 Cigarette smoking (strongest), obesity, diet and nutrition, and other environmental factors also play a role in triggering this condition.2 The worldwide prevalence of RA in the Global Burden of Disease 2010 Study was about 0.24% RA is more prevalent in women, with a lifetime risk of 3.6% in women compared to 1.7% in men.2,3 RA risk also increases with age, with a peak incidence between age 65 to 80 years of age.2 Furthermore, the prevalence of RA is more in urban areas (0.69%) than in rural areas (0.54%) and the prevalence of RA is higher in high-income countries (0.49%) compared to low-income countries (0.35.%).2,4
Gout
Gout is one of the most common causes of chronic inflammatory arthritis in the United States and is characterized by the deposition of monosodium urate monohydrate crystals in tissues.5 Gout may present clinically as an acute flare of inflammatory arthritis, chronic gout arthropathy, tophaceous deposits, uric acid nephrolithiasis, or chronic nephropathy.5 Generally, the prevalence of gout is 1% to 4% with the prevalence in Western nations being significantly higher in men (3%-6%) compared to women (1%-2%).5 The etiology of gout is typically multifactorial including genetic predisposition, dietary factors, and medical comorbidities.5
Ankylosing Spondylitis
Ankylosing spondylitis (AS) is a chronic, inflammatory disease of the axial spine with chronic back pain and progressive spinal stiffness being the most common features of the disease.6 Some commonly associated symptoms include impaired spinal mobility, postural abnormalities, buttock pain, hip pain, peripheral arthritis, enthesitis, and dactylitis.6 In the United States, the prevalence of HLA-B27 varies among ethnic groups with a 2009 survey reporting rates of HLA-B27 prevalence as 7.5% among Whites, 4.6% among Mexican-Americans, and 1.1% among Blacks.6
Psoriatic Arthritis
Psoriatic arthritis (PA) is a chronic inflammatory arthritis that occurs in around 20% of patients with psoriasis.7 This is an aggressive condition that may be characterized by diminished quality of life and significant morbidity.7 This condition is estimated to have a prevalence of around 0.05% to 0.25% in the general population and approximately 6% to 41% in individuals with psoriasis.7 There is also evidence that the prevalence of PA has been increasing over time.7,8 The onset of PA is generally observed in patients in their 30s, 40s and 50s and occurs about equally in men and women.7,9
Juvenile Idiopathic Arthritis
Juvenile idiopathic arthritis (JIA) is a varying group of idiopathic inflammatory arthritis that affects children younger than 16 and lasts 6 or more weeks.10 The causes and triggers of chronic arthritis in JIA are not clear, however, abnormal immune responses triggered by interactions between environmental factors and genetics in certain individuals are suspected to play a role.10 JIA is the most common rheumatic disease reported in children living in the Western world.10 The incidence and prevalence varies from 1.6 to 23 new cases for 100,000 children and 3.8 to 400 cases per 100,000 children depending on geographical areas, study designs, and disease categories.10
Septic Arthritis
Septic arthritis (SA) is joint inflammation secondary to an infectious cause, typically bacterial, but occasionally viral, fungal, mycobacterial, or other rare pathogens.11 Although this condition is uncommon, it is an orthopedic emergency that can lead to significant joint damage evoking increased morbidity and mortality.11 Long-term mortality in elderly individuals with SA is increased due to increased comorbid predisposing conditions in this population.11 SA has an incidence of between 2 to 6 cases per 100,000 people but differs based on the presence of risk factors.11 It is more common in children and males, with the incidence peaking between ages 2 and 3 years.11
Study Significance and Aim
This Rio Grande Valley (RGV) is a unique region with a poverty stricken, medically underserved population with a large number of undocumented immigrants, a machismo construct at play, and a high prevalence of chronic conditions such as diabetes and obesity.12–15 To our knowledge, there is no study that has analyzed all of these joint conditions in this population. This study was aimed at expanding the knowledge of orthopedics in this unique, medically underserved community. We sought to determine the demographic disparities between the different types of common joint conditions in a medically underserved region. We hypothesized that OA would follow national trends and be the most common joint condition in the RGV. We hypothesized that the demographics between the various joint conditions would vary depending on age, sex, BMI, and ethnicity.
Material and Methods
Ethical Considerations
Written IRB approval was obtained through the University of Texas Rio Grande Valley Institutional Review Board prior to starting this study (protocol number: 24-0306). Consent to participate was not acquired as there were no human participants involved in this study.
Study Design and Data Collection
This study was a retrospective cohort (level 3 evidence). Data was gathered from the University of Texas Rio Grande Valley (UTRGV) UTHealth electronic database. Data collection included medical charts from January 1, 2018, to September 4, 2024. We collected and analyzed medical charts for individuals diagnosed with OA, RA, gout, AS, PA, JIA, and SA. Patients’ charts with these diagnoses were obtained using the ICD-10 diagnosis codes M15-M19 for OA, M05-M06 for RA, M10 or M1A for gout, M45 for AS, L40.5 for PA, M08 for JIA, and M00.8 for SA. For each patient, various demographics were collected, including BMI, age at diagnosis, sex, race/ethnicity, county of residence, and marital status.
Inclusion and Exclusion Criteria
Individuals over the age of 90 were not included in the study. Individuals who were not seen by an institution associated with the UTRGV were not included in the study. If an individual’s medical chart came up multiple times, such as an individual having more than one appointment, the earliest date, the date the patient was diagnosed with any of the analyzed conditions, was included. If an individual was diagnosed with more than one of the studied conditions, all conditions were included and analyzed based on the date of diagnosis and demographics of the patient at the point in time of that specific diagnosis.
Data Analysis
Descriptive statistics were performed with information from the first visit to the registry system. Continuous variables had mean and standard deviation, while categorical variables had frequency and percentage.
We used panel data analysis to control repeated measures or clustering within subjects. The model examines the association between age at service date and joint diseases across ethnic groups, explicitly comparing non-Hispanic and Hispanic patients.
A second-panel data model was performed to analyze the effect of joint diseases adjusted by sex, ethnicity, marital status, and age on BMI. We compared two-panel regression models examining the association between BMI and various demographic and clinical factors. Model 1 includes all individuals, including those who declined to answer the ethnicity question, while Model 2 excludes this group, resulting in a slightly smaller sample size.
Results
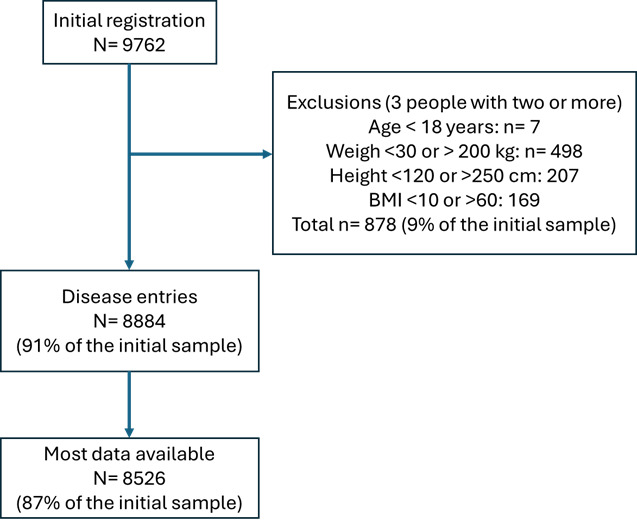
We obtained initial entries of 9762, and after cleaning the data set using inclusion and exclusion criteria, we obtained 8526 registered individual patients. However, we collected a total of 8884 entries for joint disorders. Some patients had between two and four diagnostics (Figure 1).
Descriptive statistics
Table 1 shows the demographics, counties, clinics, and diagnoses registered during the first visit to the system. The average age of participants was 65.7 (SD 12.4) years, indicating an older population typical of patients with joint-related conditions. The mean BMI was 32.5 (SD 7). On average, the sample population falls into the obese category.
The frequency of diagnosis by clinic type are as follows: UT Health Orthopedic clinics (82%), followed by UT Health (15%) and Knapp (3%). The geographical regions are Hidalgo County (66%), followed by Cameron County (34%), with Starr County contributing less than 1% of the sample. This geographic distribution is important for understanding the healthcare needs of these regions. The common diagnostic was OA (89%), as shown in Table 1, but combinations were not rare (Tables 2 and 3).
OA is by far the most common diagnosis, accounting for 87% of cases (7,418 patients) who have this diagnosis alone. Among the 7% of patients with multiple diagnoses, the most common combinations involve OA with another condition. For example, OA and RA were present in 2.42% of cases, this combination may reflect an overlap in symptoms that lead to a dual diagnosis, although they are distinct disease processes (Table 3).
Mixed linear model
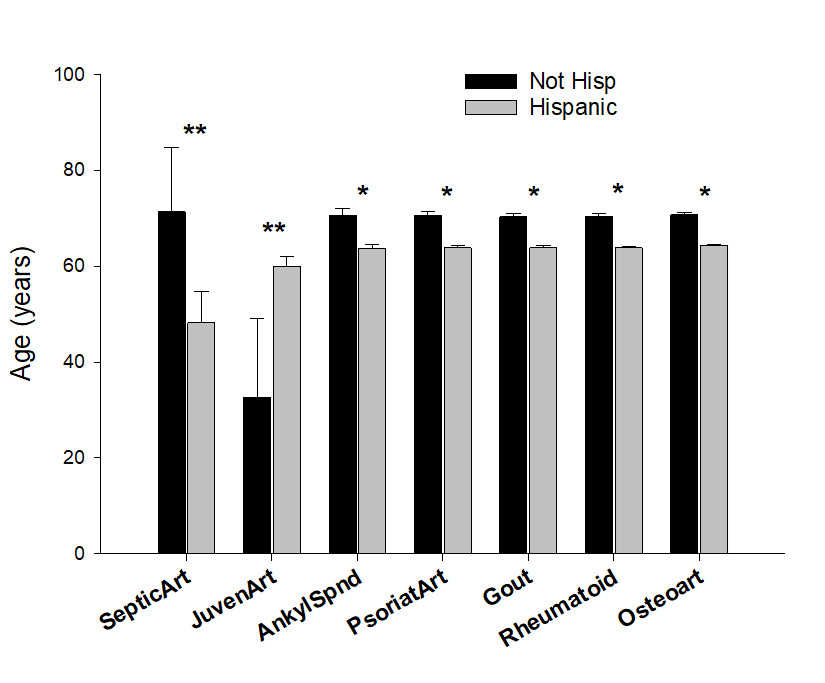
The mixed linear model with multiple diagnoses nested in individual patients (Table 4) showed the largest difference in SA, with non-Hispanic patients having an adjusted mean age of 71.3 years (95% CI: 57.9, 84.8) compared to 48.2 years (95% CI: 41.8, 54.7) for Hispanic patients. Meanwhile, JIA is unique in that Hispanic patients have a significantly higher adjusted mean age (59.9 years, 95% CI: 57.7, 62.1) than non-Hispanic patients (32.7 years, 95% CI: 16.2, 49.2), which may reflect differing age distributions or access patterns.
For other conditions like AS, PA, Gout, RA, and OA, Non-Hispanic patients consistently have a higher adjusted mean age than Hispanic patients. However, the differences are less pronounced, ranging around 6-7 years (Table 4 and Figure 2).
The analysis of association with BMI for all joint disorder categories (Gout, OA, and RA), the coefficients were slightly lower in Model 2 than in Model 1 (Table 5), suggesting those who declined to answer ethnicity may attenuate the observed association with BMI. In Model 1, the associations between BMI and Gout, OA, and RA are statistically significant, with p-values of 0.015, 0.014, and 0.030, respectively. In Model 2, these associations become marginally significant or non-significant (e.g., p-values of 0.061 for Gout and OA and 0.096 for RA), indicating that the reduced sample may slightly weaken the statistical power for these relationships (Table 5).
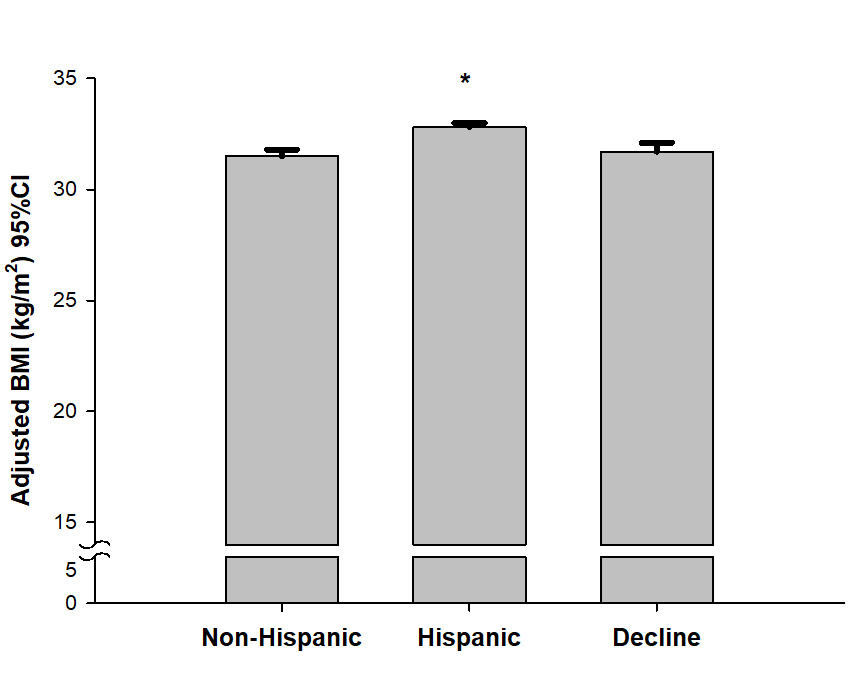
In both models (Table 5), Hispanic ethnicity showed a strong positive association with BMI compared to non-Hispanics (p < 0.001). Including those who declined to answer ethnicity in Model 1 (coefficient: 0.18, p = 0.524) shows no significant association, confirming that this group does not meaningfully affect BMI levels (Figure 3). Its exclusion in Model 2 slightly increases the coefficient for Hispanic ethnicity, indicating that BMI differences by ethnicity are robust even after excluding those with unknown ethnicity. Finally, the constant values are similar between the two models (38.04 in Model 1 and 38.22 in Model 2), suggesting a stable baseline BMI.
_adjusted_by_joint_disorder_and_ethnicity.png)
_by_ethnicity.png)
Discussion
Healthcare accessibility in the region of this study is reflected by the frequency of UT Health Orthopedic clinics (82%), followed by UT Health general clinics (15%) and Knapp medical center (3%). The geographical regions are Hidalgo County (66%), followed by Cameron County (34%), with Starr County contributing less than 1% of the study population. These percentages follow the total population trend in these counties in 2023, according to the United States Census Bureau, with Hidalgo county having the greatest population (898,471), followed by Cameron county (426,710), and Starr county (65,934).16–18 Also of note, the majority of UTRGV associated clinics and institutions are located in Hidalgo county which should theoretically increase the number of patients seen in this county compared to others. This geographic distribution is important for understanding the healthcare needs of these regions.
OA was by far the most common diagnosis in our study, accounting for 87% of cases (7,418 patients) who have this diagnosis alone. This agrees with current literature as OA has been shown to be the most common arthritis worldwide.1 Our sample consisted predominantly of older adults (65.7 (SD 12.4) years) with a high average BMI (mean 32.5 kg/m²), placing them in the obese category. This agrees with current literature and is relevant given both increased age and obesity’s link to OA.1 The increased force on joints with increasing weight can cause increased wear and tear on the articular cartilage, leading to fibrillation, irregularity and focal erosions, indicating arthritis.1 With increasing age, the articular cartilage also gets thinner due to wear and tear over the years, similarly leading to arthritis.1 These findings underscore the importance of targeting obesity and age-related joint conditions in this population.
Our results also show that ethnicity was a significant predictor of BMI, especially Hispanic ethnicity, which showed a strong positive association with BMI, even after adjusting for joint disorder type, sex, marital status, and age. The exclusion of patients who declined to report ethnicity (Model 2) resulted in slightly attenuated associations between BMI and certain joint diseases, with statistical significance reduced for Gout, OA, and RA. This suggests that including unknown ethnicity data in Model 1 may modestly strengthen observed associations, potentially due to additional variation introduced by unclassified ethnicity. Nevertheless, both models consistently highlight Hispanic ethnicity as a robust predictor of higher BMI, reinforcing the importance of focusing on weight management in Hispanic populations with joint diseases. With this association persisting across models, it confirms that Hispanic patients have significantly higher BMI levels compared to non-Hispanics. Due to the effect of BMI on joints, it should make sense that this BMI increase puts Hispanics at increased risk for arthritis, especially OA. Furthermore, current literature has shown that obesity prevalence in United States adults is highest in Hispanics when compared to non-Hispanic whites and non-Hispanic blacks.19 Additionally, adjusted mean age varies by ethnicity for certain joint conditions, with non-Hispanic patients generally presenting at an older age for most joint diseases, especially SA, but not JIA. This may infer that Hispanics are at an increased risk of arthritis since they have earlier onset, however, a national study by the CDC in 2022 states that Black non-Hispanic adults, White non-Hispanic adults, and other and multiple-race non-Hispanic adults were more likely to have arthritis than Hispanic adults.20 There are various factors that could play into this phenomenon of Hispanics having increased obesity and earlier onset of arthritis, yet lower arthritis prevalence compared to many other ethnicities or races. Hispanics are more likely to live in poverty than Whites and Asians, and are much less likely to have insurance compared to Whites, African-Americans, and Asians.21 Also, particularly in the RGV, a large population of Hispanics is undocumented and without insurance, which limits their access to healthcare.12,13 Hispanics also tend to have a lower SES and higher rates of unemployment compared to the national averages.22 Lastly, the machismo construct may impact the lack of arthritis diagnoses in the Hispanic community as this construct infers men of Latino origin may not seek healthcare due to the perception that it is seen as feminine.15 This ethnical dilemma suggests different patterns of disease onset, healthcare access, or lifestyle factors by ethnicity that could inform culturally tailored interventions.
Regarding the especially young age at which Hispanics obtain SA, and the older age at which they obtain JIA, the high prevalence of diabetes possibly leading to needing dialysis could explain the especially younger age group getting SA in the Hispanic population. Dialysis rates in Texas exceed the national average according to Texas Health and Human Services and staph aureus bloodstream infections, which are the most common cause of SA, are increased in dialysis patients.23,24 Also, end stage kidney disease is two-fold higher in Hispanics compared to non-Hispanic whites, which should increase dialysis in this population. The older age at which Hispanics acquire JIA could be due to the multiple factors mentioned earlier such as poverty, lack of insurance, being an undocumented immigrant, and the machismo construct. These factors could prevent the Hispanic individuals in our study from seeking or acquiring medical care until a later date.
This study has limitations. The data analyzed was collected solely from UTRGV UTHealth electronic databases so individuals who underwent care and were diagnosed at an institution not affiliated with UTRGV were not taken into account in this study. Therefore, this study may not be completely generalizable to the South Texas population. The majority of the patients analyzed in this study were Hispanic, which indicates that our results may not be generalizable to the United States or another nation’s general population whose ethnicity landscape is dissimilar compared to that of our study. The RGV is a poverty stricken, medically underserved area with a large population of undocumented immigrants and individuals without health insurance.12,13 This patient community is another reason the results of this study may not be universally applied as this may lead to underrepresentation of the RGV community.
Future studies should focus on obtaining a larger sample size and including more demographic factors that could play a role in the development of the various joint conditions analyzed in this study to increase study validity and generalizability.
Conclusion
These findings underscore the importance of targeting obesity and age-related joint conditions in this population, especially in communities with high healthcare needs. Ethnicity being a significant predictor of BMI, especially Hispanic ethnicity, reinforces the importance of focusing on weight management in Hispanic populations with joint diseases and may suggest different patterns of disease onset, healthcare access, or lifestyle factors by ethnicity that could inform culturally tailored interventions such as prophylaxis in the form of lifestyle changes (diet, exercise) or medications.
Data availability
The data that support the findings of this study are available from University of Texas Rio Grande Valley, but restrictions apply to the availability of these data, which were used under license for the current study, and so are not publicly available. Data are, however, available from the authors upon reasonable request and with permission of University of Texas Rio Grande Valley.
Funding statement
No funding was received for this study.
Conflict of interest disclosure
The authors declare that they have no competing interests.
Ethics approval statement
Institutional Review Board approval was obtained through the University of Texas Rio Grande Valley Institutional Review Board prior to the start of the study in accordance with the Declaration of Helsinki. IRB protocol number: 24-0306.
Authors’ contributions
B.C.M. contributed to the research design, acquisition and interpretation of data, drafting and revising the manuscript. J.L.A. contributed to the research design, analysis and interpretation of the data, and drafting of the manuscript. M.D.S. contributed to the conceptualization, investigation, validation, review and editing of the manuscript. All authors have read and approved the final submitted manuscript.