
Introduction
Nowadays the most common techniques to reduce the need for transfusion in the orthopedic surgery are based on the use of the tourniquet,1 minimally invasive surgery,2,3 diathermo-coagulation and the use of antifibrinolytic agents.4 In particular a great effort was made to reduce the need for blood transfusion in total knee arthroplasty (TKA) that remain the best surgical treatment for severe knee arthritis.5 The goals of TKA are: pain relief, restoration of normal limb alignment and a good range of motion. A successful result requires surgical technique precision to avoid soft tissue injury and painful due to component malalignment,6 appropriate materials use, and patient compliance during a rehabilitation. TKA surgery often requires blood transfusions for significant intra- and post-operative blood loss.7–9 Different techniques of blood loss prevention have been studied, but the widely accepted approach has to be established yet.10 Several authors described the knee position flexed at 90 ° for three hours after surgery and the use of antifibrinolytic agents for blood loss prevention.4 The aim of our study was to evaluate the efficacy of blood loss prevention with Tranexamic acid in patients undergoing total knee arthroplasty.
Materials and Methods
Prospective observational study was conducted at the Unit of Orthopedic and Traumatology Clinic, Universitary Hospital of Foggia.
Seventy patients affected by knee osteoarthritis were sequentially enrolled and underwent total knee arthroplasty from January to December 2020.
Inclusion criteria were: 1) knee osteoarthritis; 2) age of more than 18 years.
Exclusion criteria were: 1) subjects affected with blood coagulation disorders; 2) subjects affected with nephropathy disorders; 3) subjects affected with pre-operative anemia disorders; 4) subjects who referred a previous episode of venous thrombosis; 5) subjects taking anticoagulants or antiaggregant drugs.
All patients were properly informed of the nature of the study and they signed an informed consent document according to the Declaration of Helsinki.
Our study evaluated two groups: control group made up of 35 patients who followed the standard protocol without Tranexamic acid and study group made up of 35 patients who followed standard protocol with Tranexamic acid. The randomization criteria were applied using a predefined program (http://www.randomization.com). Both groups belonged to our clinic but to different divisions within the same clinic.
As regards the study group, we applied a bleeding reduction protocol including Tranexamic acid use. The protocol foresees specific steps: intravenous infusion of Tranexamic acid 1g (2fl) diluted in 100 ml of normal saline half an hour before starting the operation; tourniquet application for the whole operation at 250 mmHg; use of fibrillar Tabotamp (Ethicon Sarl, rue du Puits Godet 20, 2000 Neuchatel, Switzerland) for the posterior capsule and bone surfaces; bone plug to close the medullary femoral canal; intra-articular infusion of Tranexamic acid 3g (6fl) after capsule suture; 3 hours after surgery intravenous infusion of Tranexamic acid 1g (2fl) diluted in 100 ml of normal saline.
The control group, instead, was treated with traditional protocol which foresees the application of a tourniquet, the fibrillar tabotamp, and the bone plug to close the femoral canal, but without the use of Tranexamic acid.
The surgical team performed the knee replacement using the parapatellar approach for all surgeries. The implant used was Persona Posterior Stabilized (PS) (Zimmer-Biomet, Warsaw, IN, USA).
For each of recruited subjects, a data collection form was compiled including personal data, anthropometric measurements, blood tests and operative time.
We recorded the following: name, age, gender, height, weight, body max index (BMI), group (study or control), hemoglobin, hematocrit and red blood cells values at the different times, need for transfusion (yes or no), tourniquet time.
The evaluations were performed by the same surgeon to minimize inter-observer variability. The used anthropometric measurements were:
-
Weight (Kg) was measured using the scale (Seca® 861 scale) on naked subjects
-
Height (mt) was measured using the wall stadiometer (Kawe® 222), with the subject barefoot and upright and with the sagittal midline touching the back board.
-
Body mass index (kg/m2) was calculated as weight in kilograms divided by the square of the height in meters.
The two groups were compared by age, gender and body max index. We analyzed the values of hemoglobin (Hb), hematocrit (HCT) and red blood cells (RBCs) both pre-operatively (T0) and post-operatively: immediately after surgery (T1), at one day (T2) and three days post-op (T3).
We evaluated the need for any eventual blood transfusion. The indications for blood transfusion were Hb value under 8 g/dl or HCT value under 24 % within the third post-operative day.
Statistical evaluation
Data were collected using Microsoft Office Excel database and then analyzed with STATA MP12 software. The continuous variables were expressed as means with the indication of standard deviations and range or median and interquartile range (IQR). Sample size was estimated using the G power 3.1 program. The categorical variables were expressed as proportions. For the comparison of proportions, the chi-square test was used. For all the tests used, a value of p <0.05 was considered significant.
The normality of the continuous variables was evaluated and for non-normal variables, where possible, a normalization model was developed, using the exponential to the cube (x3) or the inverse of the exponential to the cube (1 / x3). To compare the normal or normalized continuous variables between the two groups, the t-student test was used for independent samples (parametric); to compare the variables at the different times within the groups and between the two groups, the anova-test for repeated measurements (parametric) was used. For the comparison of proportions between the groups, the chi-square and Fisher test were used.
Three linear regression multivariable models were developed using as outcomes: Hb values at T3, HCT values at T3, RBCs values at T3.
As regards the determinants for the three linear models, we used age, gender, body max index, group (study/control) and correspondent variables at T0. We calculated the correlation coefficient with CI 95% and t-student test was used.
For all the tests used, a value of p <0.05 was considered significant.
Results
The study sample included 70 subjects. The study group was made up of 35 subjects (50%), 24 female and 11 males. The average age, weight, height, BMI of the sample were respectively 69.40±9.1years, 68.54±4.0 kg, 1.6±0.1 mt, 25.3±1.7 kg/m2. The control group had 35 subjects (50%), 22 female and 13 males. The average age, weight, height, BMI of the sample were respectively 70.14 ±3.9 years, 69.83±4.6 kg, 1.6±0.1 mt, 26.2±2.6 kg/m2. The epidemiological anthropometric evaluations are shown in Table 1.
The average age of the sample was 69.8 ± 7.0 years (range = 51.0 – 85.0). No statistically significant difference was observed by comparison for two groups (t = 0.1; p = 0.917).
The gender analysis of the sample showed 24 out 70 patients (34.3%) were males and 46 out 70 (65.7%) were female, without statistically significant differences in the gender distribution (X2 = 0.3; p = 0.615; Graph 1). Comparing the anthropometric values for each group (height, weight and BMI) there were no statistically significant differences (p>0.05; Table 2).
_for_gender_and_group_(study_control).png)
The surgery was always performed by the same medical team and a tourniquet was used for each patient. In the study group, the average time of the use of the tourniquet was 51.37 minutes (with a range from 47 to 57 minutes), whilst in the control group was 51.94 minutes (with a range from 48 to 56 minutes). No statistically significant difference emerged between the two groups (t = 1.1; p = 0.282).
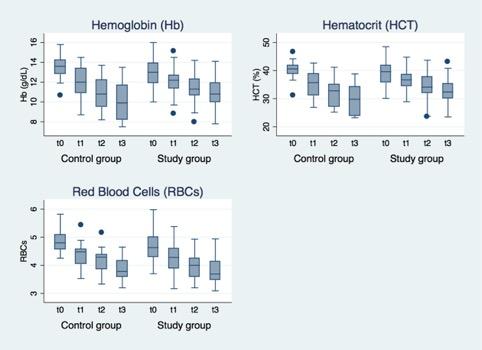
As regards the study group, the Hb, the percentage of HCT and the RBCs number value are reported in Table 3. Analyzing the decrease in the Hb average value from pre-operative to third day post-operative, there emerged a value ranging from 13.3 g/dL to 10.82 g/dL; the difference was 2.48 g/dL. As regards the decrease in the HCT value from pre-operative to third day post-operative, there emerged a value ranging from 39.15% to 32.66%; the difference was 6.49%. As regards the decrease in the RBCs value from pre-operative to the third day post-operative, there emerged a value ranging from 4.64x10⁶U/l to 3.82x10⁶ U/l., the difference was 0.82x10⁶ U/l.
As regards the control group, the Hb, the percentage of HCT and the RBCs number value are reported in Table 4. Analyzing the tendency in the decreasing of the Hb average value from pre-operative to third day post-operative, there emerged a value ranging from 13.5 g/dL to 10.1 g/dL, the difference being 3.4 g/dL. As regards the tendency in the decreasing of the HCT average value from pre-operative to third day post-operative, there emerged a value ranging from 40.2% to 29.4%, the difference being 10.8%. As regards the tendency in the decreasing of RBCs average value from pre-operative to the third day post-operative there emerged a value ranging from 4.83x10⁶U/l to 3.85x10⁶ U/l., the difference being 1.89x10⁶ U/l.
The Anova analysis for repeated measurements showed as follows:
-
A statistically significant difference comparing Hb value between different times (F = 271.4; p = 0.000) and within the groups (F = 12.9; p = 0.000). There was no statistical difference between the two groups (F = 0.4; p = 0.545).
-
A statistically significant difference comparing HCT value between different times (F = 229.1; p = 0.000) and within the groups (F = 14.0; p = 0.000). There was no statistical difference between the two groups (F = 2.3; p = 0.135).
-
A statistically significant difference comparing GRCs value between different times (F = 180.8; p = 0.000). There was no statistical difference between the two groups (F = 2.5; p = 0.119) and the relationship between times and groups (F = 1.8; p = 0.142; Graph 2).
.jpg)
By multivariable analysis, a statistically significant differences emerged between Hb values at T3 and group (coef. = 1.1; t = 3.6; p = 0.001) and Hb value at T0 (coef. = 0.9; t = 7.0; p = 0.000); we did not report any relationship with age, gender and BMI.
The multivariable analysis showed a statistical relationship between HCT at T3 and group (coef. = 4.1; t = 4.2; p = 0.000) and HCT value at T0 (coef. = 0.8; t = 5.6; p = 0.000); the other determinants were not associated to the outcome (p>0.05).
As regards the RBCs, the multivariable analysis showed a statistical relationship between RBCs at T3 and RBCs value at T0 (coef. = 0.4; t = 4.0; p = 0.000); the other determinants were not associated to the outcome (p>0.05;).
The multivariable analysis of variables Hb, HCT and RBCs value at T3 are shown in Table 5.
In the study group, 4 patients out of 35 (11.4%) had one pocket of concentrated red blood cells (GRC) transfused; no patients (0%) had 2 pockets. No thrombotic or thrombo-embolic events were reported.
In the control group, 10 patients out of 35 (28.5%) had one pocket of GRC transfused; no patients (0%) had 2 pockets. No thrombotic or thrombo-embolic events were reported.
Discussion
The results of our study allow us to demonstrate a postoperative bleeding reduction in patients treated with Tranexamic acid. It is an antifibrinolytic drug and it promotes a reduction in fibrinolysis.11 Comparing two groups, lower decrease in the blood reduction values emerged in the third day post-operative in the study group.
As regards the study group, the difference in the Hb mean value, between the pre-operative time and third day post-operative, was 2.48 g/dL whilst in the control group was 3.4g/dL. In the control group the range was wider than in the study group.
The Anova analysis for repeated measurements showed a statistically significant difference regarding the Hb value between different times (F = 271.4; p = 0.000) and the relationship between times and groups (F = 12.9; p = 0.000).
We performed the same evaluation for HCT and RBCs average value revealing a wide range between pre-operative and the third day post-operative. Observing the HCT mean value in the study group the difference was 6.49% whilst in the control group it was 10.8%. By comparison of HCT at different times (F = 229.1; p = 0.000) and the relationship between times and groups (F = 14.0; p = 0.000), statistically significant differences emerged.
Pointing out the differences in RBCs number mean value, in the study group was 0.82x10⁶ U/l whilst in the control group was 1.89x10⁶ U/l. By comparison of RBCs value between different times a significant difference emerged (F = 180.8; p = 0.000).
The Authors were able to demonstrate a statistical relationship between the Hb, HCT and RBCs values at T0 and T3 within the group using a multivariable linear regression models as reported in the tables 5. Furthermore, there was no statistical relationship between the tendency in the decreasing of the three values (Hb, HCT, RBCs) and the other determinants (group, age, gender and BMI).
Moreover, we highlighted a lower blood transfusion need in the study group: only 4 out of 35 (11.4%) patients required GRC transfusion compared to 10 patients out of 35 (28.5%) in the control group. This difference was not statistically significant (X2 = 3,2; p = 0,133) even though the number for the control group was more than double that study group. The authors attributed this discrepancy to the limited number of the sample. These data support the application of our protocol.
Surgical trauma releases the tissue plasminogen activator (t-PA). T-PA is the main enzyme responsible for the plasminogen conversion into plasmin. Thrombin also activates fibrinolysis by vascular-endothelial-PA release. Surgical stress increases the plasmin release at the vascular damage site and amplifies fibrinolysis.12 Tranexamic acid (trans-4-aminomethyl cyclohexancarboxylic acid),13 is a synthetic inhibitor of fibrinolysis which performs a competitive inhibition mechanism that prevents the plasminogen conversion into plasmin. This leads to delay of fibrinolysis: the coagulum, in fact, remains stable as plasmin cannot form and bind to fibrinogen or monomers of fribrine.14 The choice of the drug for the study was based on its safety profile and its efficacy, as reported in the literature.15
Several authors have studied Tranexamic acid to establish its effects on the bleeding reduction and for blood and derivatives transfusions need during total knee arthroplasty surgery.16 However, unanimous consensus about the dose and timing of drug administration has not been reached yet in the different studies.
Zhang et al., in a recent network meta-analysis of 15 Randomized Clinical Trials, reported that intravenous combined topical Tranexamic acid and tourniquet use provides a low total blood loss without increasing the blood transfusion risk in patients undergoing total knee replacement surgery.17 Zufferey et al. highlighted the results of intravenous administration of Tranexamic acid (15 mg/kg) at the time of surgical incision and repeated 3 hours later (total 30 mg/kg) in patients with hip fracture; the Authors reported a decrease in the blood transfusion need.18 Jong-Keun et al. carried out a 325 patients prospective randomized double-blinded placebo-controlled comparative study. The optimal dosage of topical tranexamic acid was investigated with increasing doses patients’ groups. Significant differences in total blood loss and frequency of transfusion were noted between the control group (without topical tranexamic acid) and experimental groups. Topical application of 1.0 g or more of TXA showed significant bleeding control without a dose response relationship.19 Recent systematic reviews of randomized controlled trials showed that the use of Tranexamic acid is an effective strategy for bleeding reduction, blood transfusion need and, therefore can reduce complications by up to 50%. The study indicated that this drug reduces blood loss by 300 mL.20
In our study, we used equal doses (5g) of Tranexamic acid for all patients. According to literature, an adequate dose of Tranexamic acid, ranging from 2g to 7g, needs to be administered to reduce the surgical bleeding and to inhibit fibrinolysis.21 As refers the current literature, the whole blood transfusion is indicated when the patient has hemoglobin levels <8 g/dL or HCT < 24%.22 Ballantyne et al. showed a 31% of blood transfusions reduction when using 8.5 g/dL as a cut-off value for transfusion.23
With the same objective, Zadzilka et al. recommended the choice of tolerable values of hemoglobin before recommending transfusion.24 Furthermore, in the literature, Authors studied the possibility of an increase in thromboembolic events correlated with the use of Tranexamic acid in patients undergoing medium to major orthopedic surgery.25
This increase is due to antifibrinolytic drugs effects associated with extended bed rest and prothrombotic activity inflammation-dependent. In our study, heparin prophylaxis (unfractionated subcutaneous heparin 4000 IU every 24 hours) associated with compression stockings use in the 7 post-operative days, did not show any thromboembolic events. A study evaluating the efficacy and safety of the doses increase of Traxexamic acid (1000 mg, 2000 mg and 3000 mg) in patients undergoing total knee arthroplasty showed no thrombo-embolic events in the patients examined.13
Several studies have ruled out association between Tranexamic acid use and thrombo-embolic events. A plausible explanation is related Tranexamic acid activity. It does not influence the fibrinolytic activity in the venous wall and does not promote prothrombotic activity in the patient groups studied.
This study has some limitations. The simple size is limited and the laboratory follow-up could be too short to detect any changes. Moreover, we underline the “B” group lack treated with a different technique, while we reported a control group. The data observed in this study, should be confirmed by a prospective randomized controlled study.
Conclusions
We conclude that Tranexamic acid use, as in our protocol, reduces postoperative bleeding in primary knee arthroplasty, with the absence of thrombo-embolic events. Further studies with a larger population are required to evaluate the Tranexamic acid impact on blood and derivates need as well as the relationships between the anthropometric characteristics and the dosages.
Acknowledgments
No acknowledgments
Authors’ contribution
Giuseppe Maccagnano, study designer
Vito Pesce, study designer
Giovanni Noia, article writer
Giovanni Vicenti, article writer
Michele Coviello, statistical analist
Raffaele Vitiello, statistical analist
Antonio Ziranu, article writer
Antonio Spinareli, literature reviewer
Biagio Moretti, final article reviewer
Conflict of interest
The authors declare that there are no conflicts of interest regarding the publication of this paper.
Data availability and funding statement
Readers are encouraged to contact the authors for details about the study population.
Funding
Self funding