1.1. Introduction
Total knee arthroplasty (TKA) remains as the leading performed procedures for symptomatic end-stage knee osteoarthritis, with national data showing a substantial utilization as well as a high surgical and economic burden.1–4 Although outcomes are generally favorable, postoperative complications such as venous thromboembolism, respiratory failure, sepsis, acute kidney injury, and early healthcare utilization are still leading causes for increased morbidity and cost after TKA.5,6 Effective postoperative pain control continues to be a leading discussion. The unique challenge of opioid exposure continues to raise concern due to its associations with respiratory depression, overdose, prolonged use, and other adverse complications.7,8 These concerns have led to the adoption of multimodal analgesia pathways and enhanced recovery after surgery (ERAS) protocols in total knee arthroplasty.9,10
Gabapentinoids are frequently incorporated into TKA analgesic protocols for their proposed opioid-sparing and antineuropathic benefits.11,12 Earlier studies reported significant reductions in postoperative pain and opioid consumption but also increased risks of dizziness and sedation.13 However, more recent large-scale data have questioned the clinical significance of these benefits, suggesting that analgesic improvements are small and often accompanied by higher rates of complications.14 Specific new safety literature highlights the potential for an increased risk of respiratory depression and need for naloxone rescue in the perioperative period of gabapentinoid-opioid combined use.15 Outside the surgical setting, a recent factor that has been associated with increased overdose mortality is combining gabapentinoid and opioid use, becoming a large contributor to misuse.16 Together, these findings underscore an unresolved clinical problem: gabapentinoids are widely used perioperatively, yet the balance between potential analgesic benefit and risk of harm remains controversial in real-world TKA patients and warrants further research.
A major limitation of prior studies is that most evaluate gabapentinoids as a binary “exposed” or “unexposed” variable without distinguishing between patients who continue chronic therapy, those newly initiated around the time of surgery, and those who never receive gabapentinoids perioperatively. These cohorts likely reflect distinct perioperative risk profiles: continuation patients may demonstrate pharmacologic tolerance but carry higher comorbidity and medication burden; new initiators encounter first exposure during a high-risk perioperative period often involving concurrent opioid use; and never users frequently represent the reference strategy within ERAS-based pathways.17,18
Accordingly, using a large national federated electronic health record (EHR) network and propensity score matching, this study compared 30 and 90-day postoperative outcomes after total knee arthroplasty across three mutually exclusive perioperative gabapentinoid exposure patterns (continuation vs never, continuation vs new start, and new start vs never). We hypothesized that perioperative gabapentinoid exposure would be associated with higher rates of opioid-related and respiratory adverse events, with the greatest risk among patients newly initiated around the time of surgery.
2.0. Methods
2.1. Ethics
TriNetX provides de-identified data and this study was conducted without access to directly identifiable patient information, so informed consent or an IRB was not required.
2.2. Study design and cohort
Patients undergoing total knee arthroplasty were identified using UMLS:CPT:27447, with the index date defined as the procedure date.
2.3. Perioperative gabapentinoid exposure
Gabapentinoid exposure was defined by documentation of gabapentin and/or pregabalin in the medication record. Patients were assigned to three mutually exclusive groups based on documentation relative to the index arthroplasty: continuation users (gabapentinoid documented within 3 months on or before, and again within 2 days on or after, the procedure), new-start users (no gabapentinoid in the 3 months pre-index, with documentation within 2 days post-index), and never users (no gabapentinoid in either the 3-month pre-index or 2-day post-index windows).
2.4. Outcomes and follow-up
Postoperative outcomes (opioid overdose, acute respiratory failure requiring ventilation, acute renal failure, sepsis, ED utilization, pulmonary embolism/VTE, myocardial infarction, death, cerebral infarction, prosthetic joint infection) were assessed at 30 and 90 days post-TKA, with follow-up beginning on postoperative day 1. Outcomes were defined using platform-specific concept sets from diagnosis, procedure, and medication records within each interval, without excluding patients for prior history of the outcome.
2.5. Propensity score matching
To reduce confounding, 1:1 propensity score matching was performed separately for continuation vs never, continuation vs new start, and new start vs never. Matching used baseline demographics, comorbidities, concomitant medication exposures, and available clinical measures (for example, hemoglobin A1c and body mass index when present), and covariate balance was assessed using standardized mean differences, with values < 0.10 indicating adequate balance.
2.6. Statistical analysis
For each outcome, absolute risks were calculated for each cohort and comparative estimates reported as risk differences and risk ratios with 95% confidence intervals. Time-to-event analyses used Kaplan–Meier methods with log-rank testing, and Cox proportional hazards models estimated hazard ratios with 95% confidence intervals. All tests were two-sided, with statistical significance defined as P < 0.05.
2.7. Baseline characteristics
Before matching, the TKA cohort included 126,941 continuation users, 6,227 new-start users, and 126,941 never users. After 1:1 propensity score matching, there were 126,941 continuation and 126,941 never users, 6,227 continuation and 6,227 new-start users, and 6,221 new-start and 6,221 never users. Across all matched comparisons, baseline age, sex, race/ethnicity, comorbidity burden (including hypertension and diabetes), and use of opioids and sedative-hypnotics were closely balanced, with standardized mean differences below 0.10 for all covariates.
3.0 Data Analyses
3.1. Study Population and Propensity Score Matching
In the total knee arthroplasty cohort, patients were classified into three mutually exclusive perioperative gabapentinoid exposure groups: continuation, new-start, and never users; before matching, there were 126,941 continuation users, 6,227 new-start users, and 126,941 never users. After separate 1:1 propensity score matching for continuation versus never, continuation versus new start, and new start versus never, the matched samples included 126,941 continuation and 126,941 never users (Table 1A), 6,227 continuation and 6,227 new-start users (Table 1B), and 6,221 new-start and 6,221 never users (Table 1C), with standardized mean differences below 0.10 for all covariates.
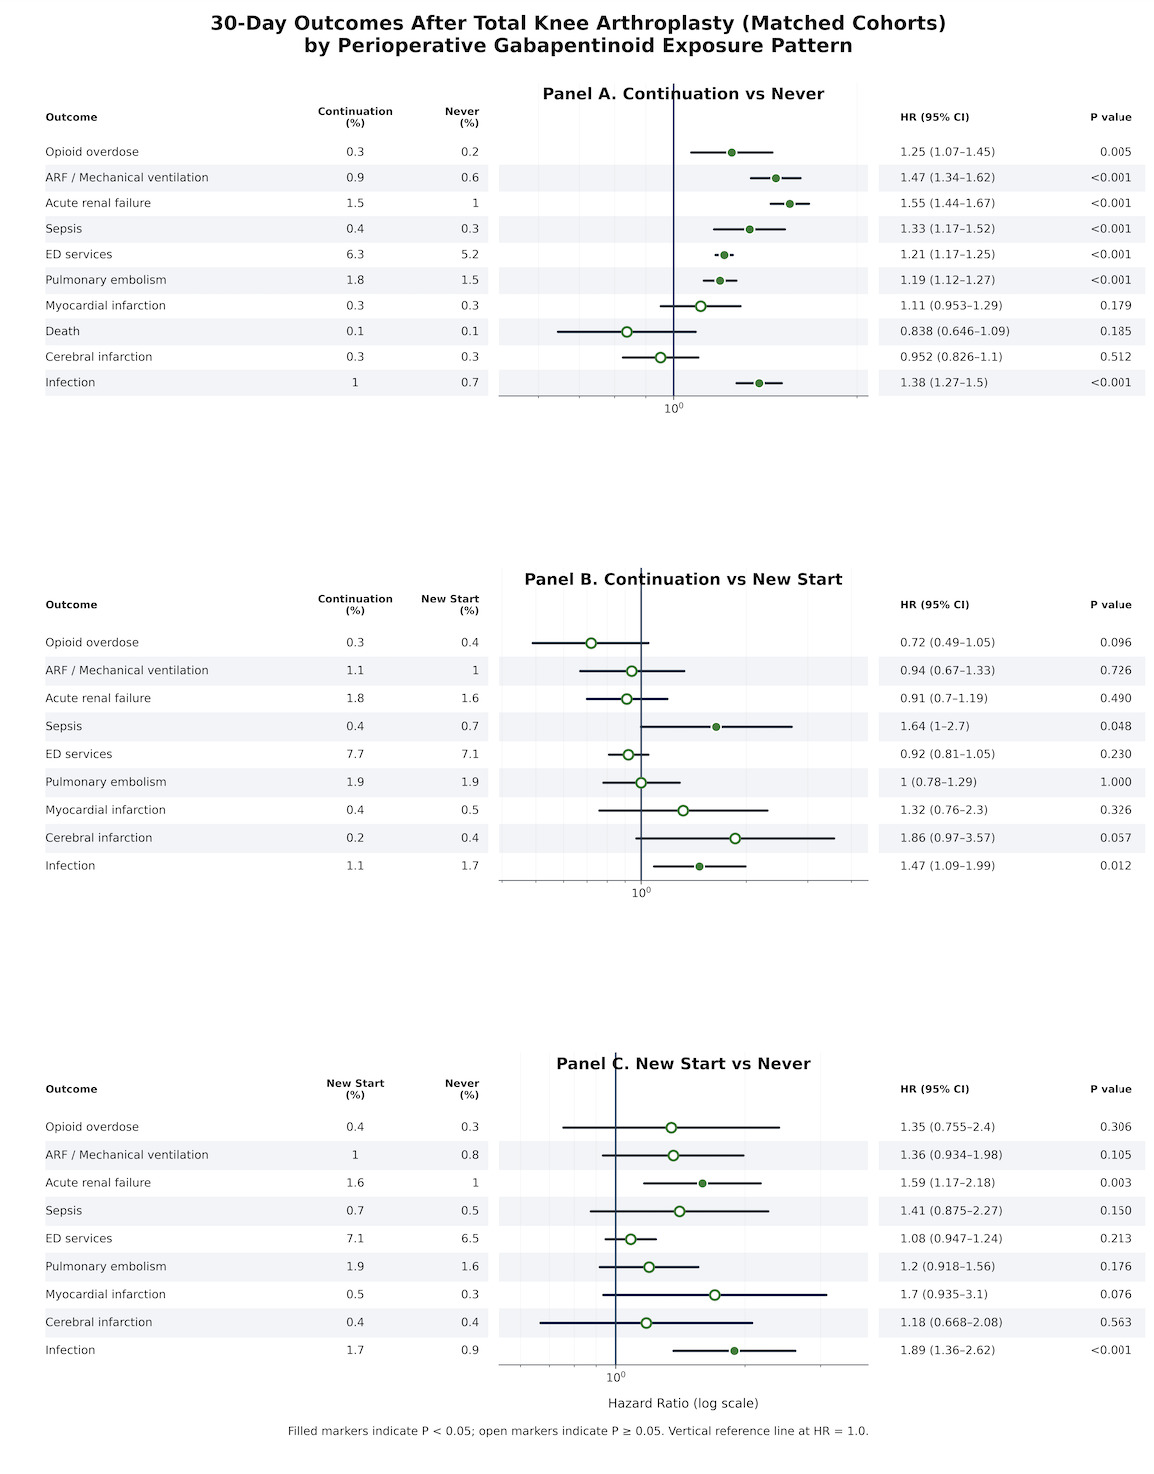
3.2. Thirty-day outcomes
Continuation vs Never
Within 30 days of total knee arthroplasty, continuation users experienced higher rates of several complications compared with never users. Absolute risks and effect estimates indicated increased opioid overdose (0.3% vs 0.2%; RR 1.247, 95% CI 1.071-1.454), acute respiratory failure requiring mechanical ventilation (0.9% vs 0.6%; RR 1.472, 95% CI 1.341-1.616), acute renal failure (1.5% vs 1.0%; RR 1.550, 95% CI 1.442-1.665), sepsis (0.4% vs 0.3%; RR 1.333, 95% CI 1.167-1.523), emergency department utilization (6.3% vs 5.2%; RR 1.205, 95% CI 1.167-1.243), pulmonary embolism (1.8% vs 1.5%; RR 1.192, 95% CI 1.121-1.266), and postoperative infection (1.0% vs 0.7%; RR 1.381, 95% CI 1.268-1.503). Thirty-day risks of myocardial infarction, cerebral infarction, and death were low and did not differ significantly between continuation and never users (myocardial infarction RR 1.109, 95% CI 0.954-1.289; cerebral infarction RR 0.953, 95% CI 0.827-1.099; death RR 0.839, 95% CI 0.646-1.088).
Continuation vs New Start
In contrast, most 30-day outcomes were similar between continuation and new-start users. Continuation users showed no statistically significant differences in opioid overdose (0.3% vs 0.4%; RR 0.72, 95% CI 0.49-1.06), acute respiratory failure requiring mechanical ventilation (1.1% vs 1.0%; RR 0.94, 95% CI 0.67-1.32), acute renal failure (1.8% vs 1.6%; RR 1.00, 95% CI 0.82-1.22), emergency department utilization (7.7% vs 7.1%; RR 0.93, 95% CI 0.82-1.05), pulmonary embolism (1.9% vs 1.9%; RR 1.00, 95% CI 0.78-1.28) relative to new-start patients, with risk ratios generally close to 1.00 and confidence intervals crossing unity. However, continuation therapy was associated with a higher 30-day risk of postoperative infection compared with new initiation (1.1% vs 1.7%; RR 1.47, 95% CI 1.09-1.98).
New Start vs Never Users
Within 30 days of total knee arthroplasty, new-start patients had higher risks of acute renal failure (1.6% vs 1.0%; RR 1.594, 95% CI 1.168-2.174), emergency department utilization (7.1% vs 6.5%; RR 1.086, 95% CI 0.954-1.237), pulmonary embolism (1.9% vs 1.6%; RR 1.198, 95% CI 0.922-1.557), and postoperative infection (1.7% vs 0.9%; RR 1.891, 95% CI 1.366-2.617), along with numerically higher but imprecise estimates for opioid overdose (0.4% vs 0.3%; RR 1.350, 95% CI 0.758-2.404), myocardial infarction (0.5% vs 0.3%; RR 1.706, 95% CI 0.938-3.101), and cerebral infarction (0.4% vs 0.4%; RR 1.182, 95% CI 0.671-2.083). Several of these differences, specifically acute renal failure and infection, reached statistical significance, emphasizing early vulnerability among new-start users.

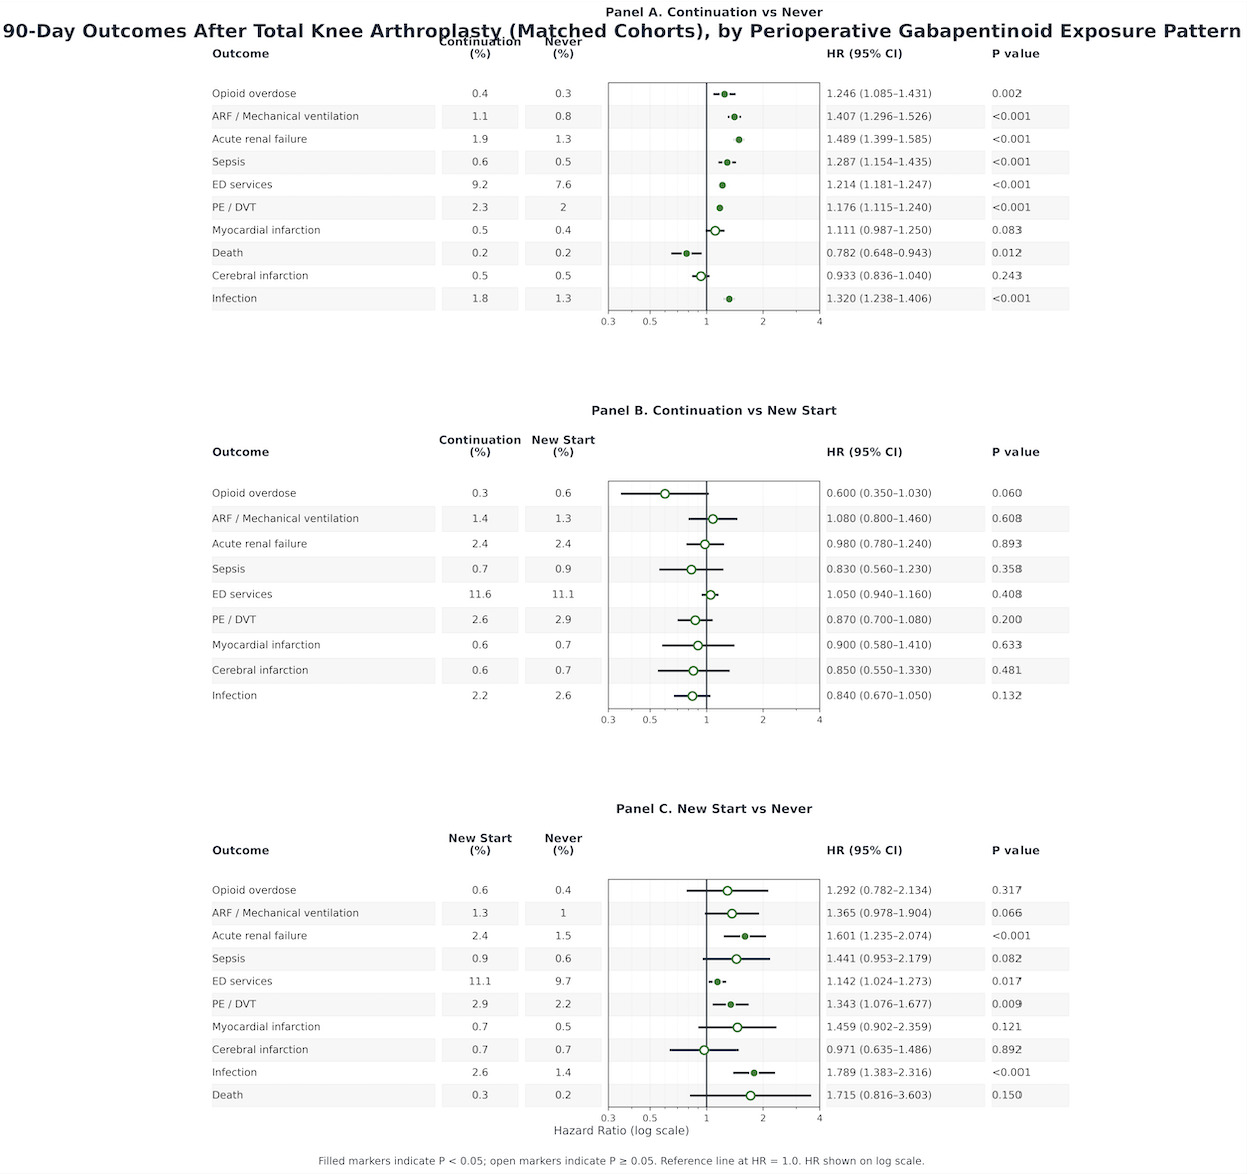
3.3. Ninety-day outcomes
Continuation vs Never
By 90 days, the pattern of excess risk among continuation users relative to never users persisted and, for several outcomes, widened. Continuation therapy remained associated with higher risks of opioid overdose (0.4% vs 0.3%; RR 1.249, 95% CI 1.088-1.434), acute respiratory failure (1.1% vs 0.8%; RR 1.409, 95% CI 1.299-1.528), acute renal failure (1.9% vs 1.3%; RR 1.489, 95% CI 1.400-1.584), sepsis (0.6% vs 0.5%; RR 1.291, 95% CI 1.158-1.439), emergency department utilization (9.2% vs 7.6%; RR 1.208, 95% CI 1.177-1.239), venous thromboembolism (2.3% vs 2.0%; RR 1.177, 95% CI 1.117-1.241), and infection (1.8% vs 1.3%; RR 1.314, 95% CI 1.234-1.399). Mortality at 90 days was slightly lower among continuation users (0.2% vs 0.2%; RR 0.786, 95% CI 0.652-0.948), although absolute differences were small and must be interpreted in the context of competing risks.
Continuation vs New Start
At 90 days, continuation and new-start users showed broadly comparable risks for most outcomes. Risks of opioid overdose, acute respiratory failure, acute renal failure, sepsis, emergency department utilization, venous thromboembolism, myocardial infarction, cerebral infarction, infection, and death were generally similar, with no clear advantage of either continuation or new initiation over this longer horizon.
New Start vs Never Users
New-start patients had increased risks of opioid overdose (0.6% vs 0.4%; RR 1.296, 95% CI 0.786-2.139), acute respiratory failure (1.3% vs 1.0%; RR 1.367, 95% CI 0.981-1.903), acute renal failure (2.4% vs 1.5%; RR 1.602, 95% CI 1.240-2.071), sepsis (0.9% vs 0.6%; RR 1.447, 95% CI 0.959-2.185), emergency department utilization (11.1% vs 9.7%; RR 1.142, 95% CI 1.030-1.266), venous thromboembolism (2.9% vs 2.2%; RR 1.346, 95% CI 1.081-1.675), and infection (2.6% vs 1.4%; RR 1.789, 95% CI 1.385-2.310). Differences in myocardial infarction, cerebral infarction, and death were directionally similar but less precisely estimated, with several confidence intervals including the null (myocardial infarction RR 1.464, 95% CI 0.907-2.365; cerebral infarction RR 0.977, 95% CI 0.639-1.492; death RR 1.727, 95% CI 0.823-3.627).
Overall, across both 30 and 90-day horizons, never users consistently exhibited the lowest rates of serious postoperative complications, while new-start gabapentinoid users demonstrated the highest risk profile, and continuation users occupied an intermediate but still unfavorable position relative to never users.

4.0. Discussion
In this nationwide propensity score matched retrospective cohort study of adults undergoing total knee arthroplasty (TKA), perioperative gabapentinoid exposure was associated with higher short-term postoperative complication rates that varied by exposure pattern. Within the continuation versus never comparison, continuation was linked to significantly increased 30- and 90-day risks of opioid overdose, acute respiratory failure requiring mechanical ventilation, acute kidney injury, sepsis, emergency department utilization, venous thromboembolism, and postoperative infection, suggesting that even chronic gabapentinoid use continued perioperatively may be clinically meaningful.
In contrast, direct comparison between continuation and new-start users showed broadly similar complication rates at both timepoints. Aside from postoperative infection at 30 days, higher among continuation users but attenuated by 90 days, no meaningful differences were seen for respiratory failure, acute kidney injury, venous thromboembolism, myocardial infarction, emergency department utilization, or mortality, indicating that continuation may blunt some acute risks of initiation but does not eliminate perioperative risk. New-start users consistently had worse outcomes than never users, particularly for acute kidney injury, postoperative infection, venous thromboembolism, and emergency department utilization, implicating perioperative initiation of gabapentinoids as the highest-risk exposure pattern.
These TKA-specific findings align with an evolving literature questioning the net perioperative benefit of gabapentinoids in major orthopaedic surgery. Early systematic reviews suggested modest opioid-sparing effects, often accompanied by increased dizziness and sedation, while more recent large-scale analyses indicate that analgesic benefits frequently fall below clinically meaningful thresholds.14,19 Contemporary enhanced recovery after surgery (ERAS) protocols for TKA increasingly emphasize multimodal analgesia strategies that minimize centrally acting medications, particularly in older patients with cardiometabolic comorbidities and high baseline opioid exposure, a demographic well represented in this cohort.20
Several biologically plausible mechanisms help explain the observed safety signals. Gabapentinoids exhibit pharmacodynamic synergy with opioids and sedative-hypnotics, potentiating ventilatory depression, blunting arousal responses, and impairing early postoperative mobilization.21 These effects are likely amplified during the immediate postoperative period, characterized by peak opioid dosing, reduced mobility, and frequent co-administration of sedatives. This temporal vulnerability helps explain why new-start users demonstrated the most consistently adverse outcomes, whereas continuation users, despite possible tolerance to sedative effects, remained susceptible when exposed to acute postoperative pharmacotherapy.21,22
This study shares limitations of retrospective electronic health record–based research. Despite large, multi-institutional real-world data and strong covariate balance (standardized mean differences < 0.10), residual confounding from unmeasured factors (such as pain severity, functional status, frailty, sleep apnea severity, anesthetic technique, rehabilitation adherence, and actual medication consumption) likely persists. Gabapentinoid exposure was based on medication documentation and did not capture dose, timing, formulation, inpatient administration details, or adherence, introducing potential misclassification. Outcomes, derived from diagnosis, procedure, and medication codes, may under-ascertain events, miss severity, or reflect documentation practices rather than true incidence. Thus, these findings should be viewed as identifying higher-risk perioperative exposure patterns rather than proving causality, and confirmation through randomized trials and pragmatic studies within modern TKA enhanced recovery pathways is needed.
4.1. Clinical Implications
These findings support a selective, individualized approach to perioperative gabapentinoid use after TKA. Routine postoperative initiation as part of standardized ERAS pathways is discouraged, given consistently worse outcomes among new-start users. Although continuation appears less harmful than new initiation, it remains inferior to no perioperative exposure, suggesting chronic therapy should not be continued reflexively. Decisions should consider dose, renal function, respiratory risk factors (for example, obesity and obstructive sleep apnea), and concurrent opioid or sedative use. Acute kidney injury, postoperative infection, and venous thromboembolism emerge as key safety signals warranting focused evaluation in future prospective TKA analgesia trials.
5.0. Conclusion
Among adults undergoing TKA perioperative gabapentinoid exposure, whether through chronic continuation or new postoperative initiation, was associated with higher 30- and 90-day rates of acute kidney injury, postoperative infection, emergency department utilization, and venous thromboembolism compared with never users. New initiation demonstrated the most consistently adverse profile across endpoints, while continuation users still had intermediate but still unfavorable outcomes relative to no exposure. These findings support selective, patient-specific perioperative gabapentinoid strategies rather than routine use within TKA enhanced recovery pathways and highlight the need for randomized trials evaluating dose-optimized regimens, opioid co-administration effects, and key safety endpoints to clarify when gabapentinoids may offer meaningful net benefit.
Authors’ contributions
All authors meet ICMJE authorship criteria and approve the final manuscript.
Abdel Kareem Hilo: Conceptualization; Study design; Data acquisition/curation; Statistical analysis; Interpretation of results; Drafting the manuscript.
Jawad Saad: Study design; Interpretation of results; Critical revision of the manuscript for important intellectual content.
Alqasim Elnaggar: Data acquisition/curation; Methodology; Interpretation of results; Critical revision of the manuscript.
Bashar Jawich: Supervision; Interpretation of results; Critical revision of the manuscript.
Tarek Harhash: Had access to the study data and took responsibility for the integrity of the data and accuracy of the analysis; Project administration; Manuscript guarantor.
Rahul Vaidya: Project Administration, Interpretation of results; Critical revision of the manuscript for important intellectual content.
Disclosures / conflicts of interest
Each author completed conflict-of-interest disclosure consistent with ICMJE recommendations.
Conflicts of interest: The authors declare no conflicts of interest related to this work.
Funding / support
This work received no specific external funding.
Ethics
This study used de-identified data; informed consent and IRB review were not required, per the data platform’s de-identification model.