
INTRODUCTION
Ankle fractures make up 9–10% of all fractures, with approximately 40% requiring surgical intervention.1,2 Risk factors include age, osteoporosis, and low-energy trauma in older adults, whereas younger patients more often sustain high-energy, frequently sports-related injuries.3–6 Isolated lateral malleolus, isolated medial malleolus, bimalleolar, and trimalleolar fractures represent the primary operative patterns, with trimalleolar fractures reflecting greater joint disruption.1,7,8
Studies of ORIF outcomes report low short- and intermediate-term complication rates and identify diabetes mellitus and peripheral vascular disease as correlates of early postoperative complications.9–11 Absolute outcome proportions at a decade, reported separately for each operative fracture pattern and for common comorbidity groups, are less widely available. Such figures are useful in preoperative counseling, where the practical question is how often a given event has been recorded by a given timepoint in patients resembling the one in the room.12,13
The present study reports absolute, fracture-pattern– and comorbidity-stratified cumulative incidence of coded postoperative events at 90 days and at 2, 5, and 10 years after ankle ORIF in a large EHR-derived cohort, estimated within a competing-risks framework in which death from any cause is treated as a competing event rather than as continued event-free follow-up. It is purely descriptive, with the primary aim of characterizing 10-year outcomes for each operative fracture pattern in patients with and without common medical comorbidities.
PATIENTS AND METHODS
Study design and data source
This retrospective, descriptive cohort study followed the STROBE and RECORD statements and used de-identified, aggregated data from the TriNetX Research Network, which aggregates electronic health record data from large academic health care organizations across the United States. Because only aggregated counts were analyzed, the study was exempt from institutional review board review under institutional policy.
Cohort construction
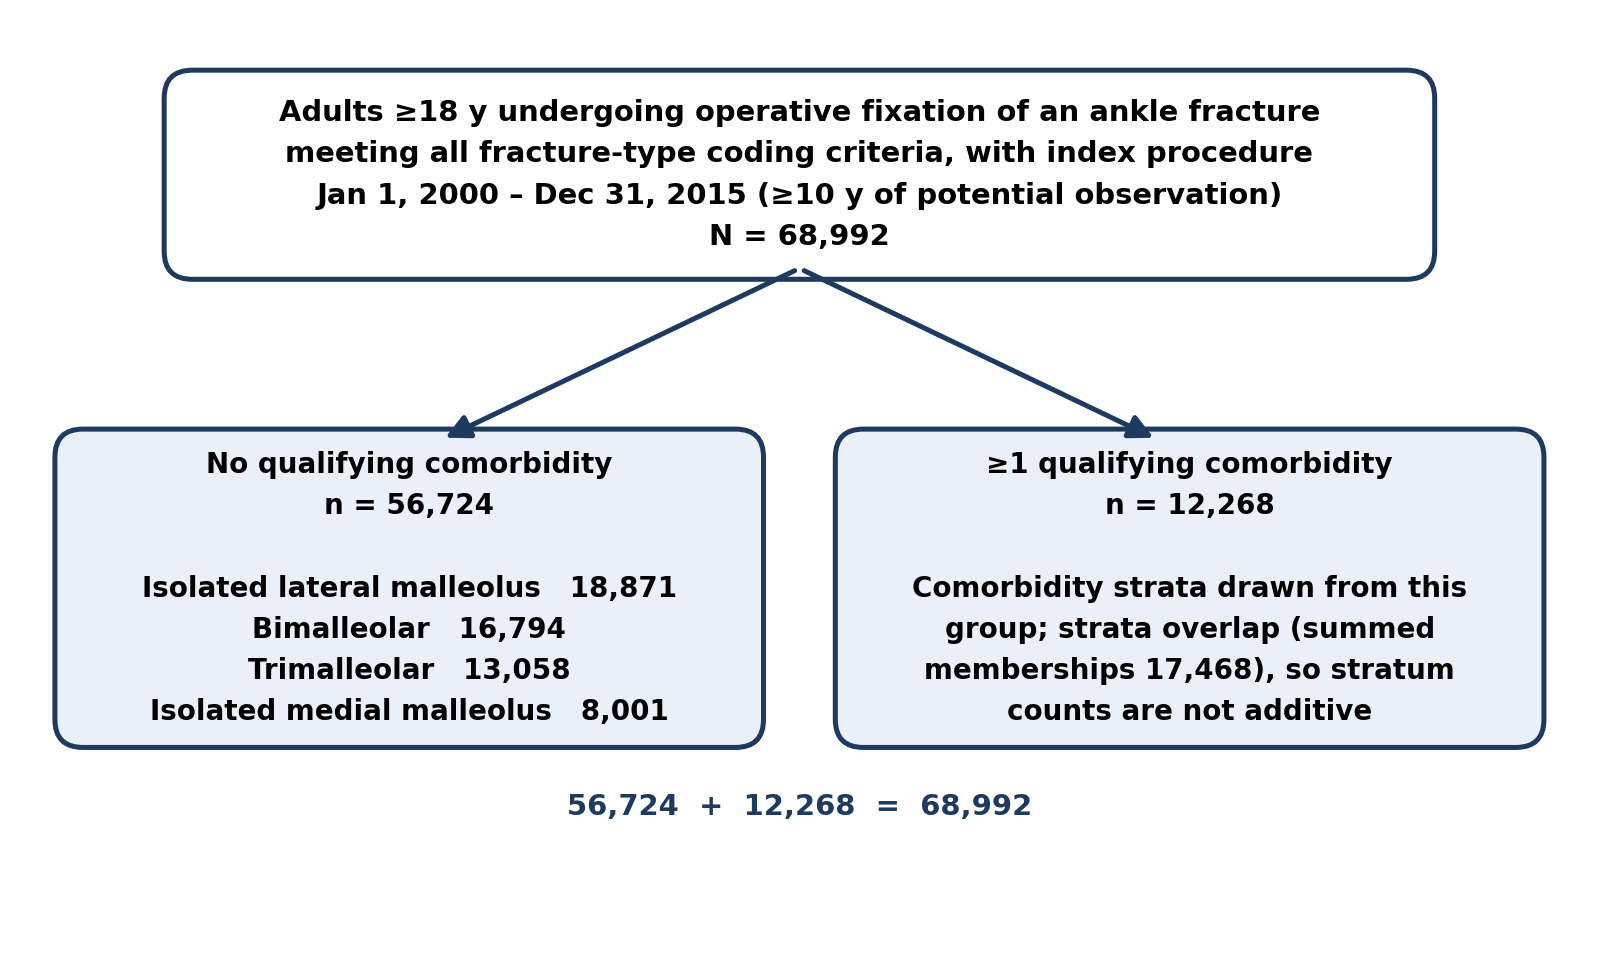
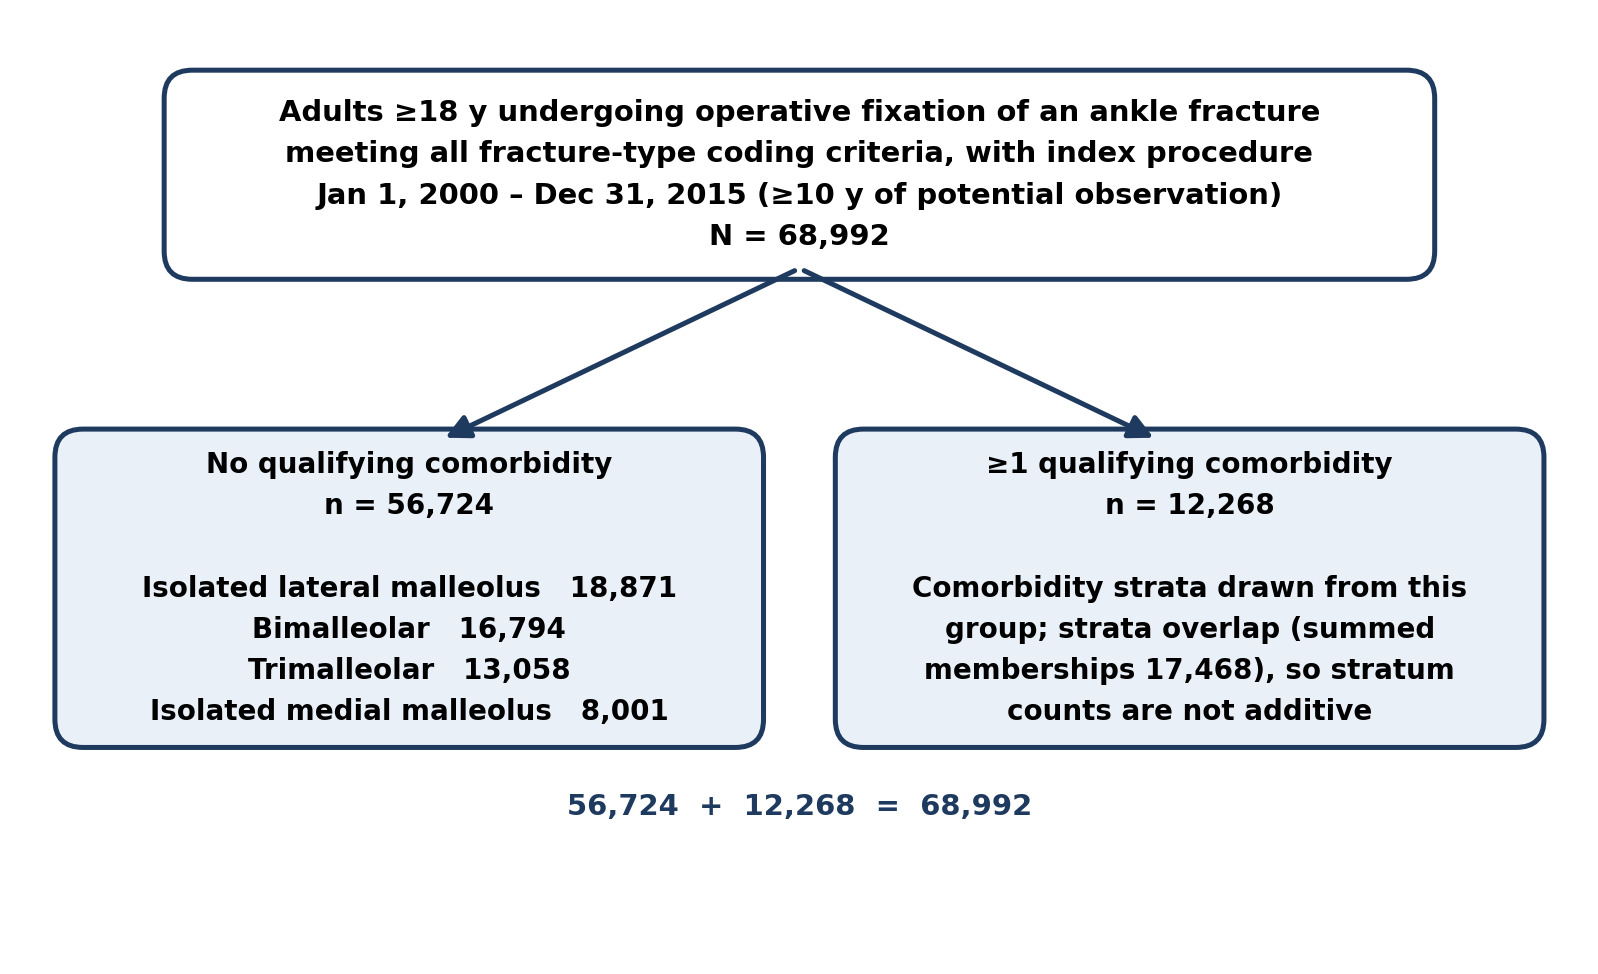
Adults (≥18 years) undergoing operative fixation of an ankle fracture were assigned to one of four mutually exclusive fracture-type cohorts, each requiring both the relevant fracture diagnosis and a fixation procedure. The isolated medial and isolated lateral cohorts excluded concurrent involvement of the other malleoli, including the posterior malleolus; the bimalleolar cohort required medial and lateral involvement, and the trimalleolar cohort medial, lateral, and posterior involvement. Patients with additional malleolar components that would reclassify the pattern, bilateral ankle injuries, or other ipsilateral lower-extremity fractures at the index encounter were excluded. Within each cohort, patients were described across comorbidity strata identified at or before the index procedure — diabetes mellitus, peripheral vascular disease, liver disease, renal failure, and open fracture (Gustilo I–IIIC) — alongside a no-comorbidity reference column. Code lists, baseline characteristics, and cohort derivation appear in Supplementary Tables 1–2 and Figure 1.
Outcomes
Outcomes comprised 90-day postoperative infection, 90-day venous thromboembolism (VTE), open repair of nonunion/malunion, and clinically attended post-traumatic arthritis (a coded, symptomatic rather than radiographic diagnosis). Conversion to arthrodesis/arthroplasty and hardware removal were reported as healthcare-utilization outcomes; conversion may be read as a surrogate for end-stage joint failure. Each outcome is reported as the cumulative incidence of a first coded event within the stated interval (90 days; 2, 5, and 10 years), estimated in the presence of death as a competing event. All-cause mortality was handled in two ways: it is reported as an outcome in its own right at 90 days (Tables 1–4), and it serves as the competing event for every non-fatal outcome at every timepoint. The interval-specific death counts entering the competing-event hazard at 90 days and at 2, 5, and 10 years are given in Appendix Table A1.
Eligibility and Observation Window
Eligibility required the potential for 10 years of observation rather than documentation that it occurred: patients were included if the index fixation procedure fell between January 1, 2000 and December 31, 2015, so that every patient had at least 3,650 days of potential observation before data extraction, with no requirement for a recorded encounter at or after that threshold. A total of 68,992 adults met the age, fracture-diagnosis, fixation-procedure, and cohort-exclusion criteria within this calendar window. Of these, 56,724 carried none of the qualifying comorbidity codes and constitute the no-comorbidity reference cohorts (isolated lateral 18,871; bimalleolar 16,794; trimalleolar 13,058; isolated medial 8,001), and 12,268 carried at least one. Because the comorbidity strata are not mutually exclusive, a patient meeting criteria for more than one condition contributes to each stratum (Figure 1).
Analysis
Analyses were descriptive. For every outcome, comorbidity stratum, fracture pattern, and timepoint we report the observed event count and the cumulative incidence function (CIF). Death from any cause was specified as the competing event. Loss to follow-up was treated as independent right censoring. The complement of a CIF is not a survival probability, and CIFs for different outcomes within a stratum are not additive. Interval-specific competing-death counts are reported in Appendix Table A1. Cells with fewer than 10 patients were suppressed in accordance with the TriNetX reporting threshold and are shown as em dashes. Ninety-five percent confidence intervals accompany each cumulative incidence estimate and are reported to convey the precision of that estimate within its own stratum. Analyses were performed in Python 3.14.
RESULTS
Study population
Of 68,992 calendar-eligible adults, 56,724 carried none of the qualifying comorbidity codes and comprised the four no-comorbidity reference cohorts: isolated lateral malleolus (n = 18,871), bimalleolar (n = 16,794), trimalleolar (n = 13,058), and isolated medial malleolus (n = 8,001); the remaining 12,268 carried at least one qualifying comorbidity and populate the overlapping strata. Mean age at index was 43.4 years (isolated lateral), 38.0 (isolated medial), 48.7 (bimalleolar), and 51.7 (trimalleolar); the proportion female was 50.0%, 43.5%, 60.2%, and 71.8% respectively (Supplementary Table 2). All cumulative incidence estimates are presented in Tables 1–4, and the competing-death counts underlying them in Appendix Table A1.
90-day complications
In the no-comorbidity reference cohorts, the 90-day cumulative incidence of coded postoperative infection was 1.93% (isolated lateral malleolus), 2.28% (isolated medial malleolus), 2.26% (bimalleolar), and 2.03% (trimalleolar). Across the comorbidity strata it ranged from 3.21% to 9.61%, the highest being the isolated medial malleolus peripheral vascular disease stratum (9.61%; 23 events, baseline N = 242). The 90-day cumulative incidence of venous thromboembolism in the reference cohorts was 1.85%, 2.19%, 1.61%, and 1.65% respectively, and ranged from 2.82% to 8.62% across the comorbidity strata, the highest being the isolated medial malleolus renal-failure stratum (8.62%; 51 events, baseline N = 595). All-cause mortality within 90 days was 0.30%, 0.36%, 0.66%, and 0.75% in the reference cohorts and ranged from 1.01% to 4.15% across the comorbidity strata, the highest being the trimalleolar peripheral vascular disease stratum (4.15%; 29 events, baseline N = 700) (Tables 1–4).
Intermediate-term outcomes
In the no-comorbidity reference cohorts, the cumulative incidence of clinically attended arthritis by 2 years was 10.74% for isolated lateral malleolus, 9.05% for isolated medial malleolus, 9.83% for bimalleolar, and 12.53% for trimalleolar fractures; by 5 years, the corresponding estimates were 14.20%, 12.40%, 13.10%, and 15.70%. Hardware removal by 2 years was 11.58%, 12.93%, 10.77%, and 10.60%, respectively, and by 5 years was 12.73%, 14.06%, 11.85%, and 11.55%. Conversion to arthrodesis/arthroplasty by 2 years was 0.35%, 1.13%, 0.68%, and 1.09%, respectively, and by 5 years was 0.44%, 1.48%, 0.77%, and 1.28%. Because death was modeled as a competing event, each value is the probability of a coded event having been recorded by that timepoint among patients who had not yet died, and should not be read as the proportion of a fixed baseline denominator or as an interval-specific incidence rate (Tables 1–4).
Outcomes by fracture pattern
In the no-comorbidity reference cohorts, the 10-year cumulative incidence of conversion to arthrodesis/arthroplasty was 0.48% (91 events; isolated lateral malleolus), 1.62% (129 events; isolated medial malleolus), 0.79% (133 events; bimalleolar), and 1.30% (170 events; trimalleolar). Open repair of nonunion/malunion by 10 years was 0.82%, 1.73%, 0.38%, and 0.32% respectively. Clinically attended arthritis by 10 years was 18.71%, 17.1%, 17.8%, and 20.2%, and hardware removal by 10 years was 13.09%, 14.32%, 12.07%, and 11.69%. Across all four patterns, hardware removal and conversion to arthrodesis/arthroplasty accrued predominantly within the first 2 years, with modest additional accrual thereafter, whereas clinically attended arthritis continued to accrue across the full 10-year horizon.
Competing-event burden
Cumulative deaths by 10 years, which constitute the competing-event burden removed from the risk set, totaled 524 of 18,871 (2.8%) in the isolated lateral malleolus reference cohort, 245 of 8,001 (3.1%) in the isolated medial malleolus reference cohort, 729 of 16,794 (4.3%) in the bimalleolar reference cohort, and 617 of 13,058 (4.7%) in the trimalleolar reference cohort. The burden was several-fold greater in the comorbidity strata, reaching 13.9% to 29.2% across the renal-failure strata and 14.1% to 26.9% across the peripheral vascular disease strata, with the largest value in the trimalleolar renal-failure stratum (398 of 1,362; 29.2%). The interval-specific counts are given in Appendix Table A1.
Late secondary procedures and clinically attended arthritis
In the comorbidity strata, 10-year cumulative incidence of clinically attended arthritis ranged from 15.20% to 22.60%, the highest value being the isolated medial malleolus peripheral vascular disease stratum (22.60%; 52 events, baseline N = 242). Ten-year cumulative incidence of conversion to arthrodesis/arthroplasty in the comorbidity strata ranged from 0.97% to 6.34%, the highest being the isolated medial malleolus diabetes stratum (6.34%; 16 events, baseline N = 259). Ten-year hardware removal ranged from 10.42% to 19.83%, and open repair of nonunion/malunion, where estimable, from 1.18% to 4.30%, the highest being the isolated lateral malleolus open-fracture stratum. Estimates at 90 days and at 2, 5, and 10 years for every outcome and stratum are given in Tables 1–4.
DISCUSSION
This report tabulates competing-risks cumulative incidence of coded postoperative events after ankle ORIF in 68,992 calendar-eligible adults, separately for four operative fracture patterns and five comorbidity strata, at 90 days and at 2, 5, and 10 years. The present study adds long term outcomes to existing literature of aggregate or single-timepoint figures at the level of resolution a preoperative conversation actually requires: the fracture, the comorbidity, and the time horizon.
The most informative feature of these tabulations is how differently the four late outcomes accrue. Hardware removal is essentially a first-two-year event: in the no-comorbidity reference cohorts, 2-year estimates of 10.60–12.93% rise only to 11.69–14.32% by 10 years, so roughly nine in ten removals that will occur have occurred by 24 months. Open repair of nonunion/malunion behaves the same way and is nearly complete by 2 years (isolated lateral 0.79% at 2 years, 0.82% at 10 years). Conversion to arthrodesis or arthroplasty is rare throughout but follows the same early pattern, with 70–86% of the 10-year cumulative incidence already accrued by 2 years across the four patterns (isolated lateral 0.35% of 0.48%; isolated medial 1.13% of 1.62%; bimalleolar 0.68% of 0.79%; trimalleolar 1.09% of 1.30%). Clinically attended arthritis is the exception: it continues accruing across the full horizon, roughly doubling from 9.05–12.53% at 2 years to 17.10–20.20% at 10 years.
This divergence is the practical content of the tables. A patient asking about reoperation is asking about two distinct processes on two distinct clocks, an early, largely elective implant-related one, and a late, degenerative one, and the counseling literature has not previously separated them by pattern at fixed horizons. Prior population data are consistent with the early clustering: a population-based Ontario cohort of 45,444 ankle ORIF patients found isolated implant removal accounted for the large majority of intermediate-term reoperation (18.1%), with reoperation for any other reason at 1.5%.14 The Finnish nationwide register similarly reports fixation-device removal as the dominant long-term reoperation, with 17% cumulative incidence by 3 years.10
Across the reference cohorts the pattern gradient is modest for most outcomes and largest for arthritis, which is highest after trimalleolar injury (20.20% at 10 years) and lowest after isolated medial fracture (17.10%). Conversion to arthrodesis/arthroplasty follows a different ordering, being lowest after isolated lateral fracture (0.48%) and highest after isolated medial fracture (1.62%). No comparison was tested and the strata are unadjusted, so these orderings are reported as observed rather than interpreted.
For orientation only, published aggregate estimates for conversion to fusion or arthroplasty are of similar magnitude to those reported here. Axelrod et al.,13 matching 44,133 operatively treated ankle fractures to population controls, reported 0.65% undergoing fusion or arthroplasty, and SooHoo et al.11 reported 0.96% at five years; the 10-year reference-cohort values here span 0.48–1.62%. These figures are not directly comparable, but the agreement in order of magnitude supports the internal plausibility of the rarest endpoint.
Modeling death explicitly is the analytic choice that distinguishes these tabulations from crude proportions, and its practical importance varies sharply across the tables. In the reference cohorts, cumulative deaths by 10 years were 2.8–4.7%, and the competing-risks and crude estimates are close. In the comorbidity strata the burden is several-fold greater, reaching 29.2% in the trimalleolar renal-failure stratum, with most renal-failure and peripheral vascular disease strata between 14% and 22%. These are precisely the strata in which a naïve estimate that retains decedents as event-free diverges most from the competing-risks estimate, a phenomenon well documented in registry-based orthopaedic outcome research, where the magnitude of divergence grows with follow-up duration and with the frequency of the competing event.15,16
LIMITATIONS
This study has several limitations inherent to its design. Every outcome is defined by diagnosis, procedure, and billing codes subject to miscoding and unverifiable against charts, imaging, or operative notes, and ascertainment depends on care delivered within contributing organizations, so events treated elsewhere are unobserved; each estimate is therefore a lower bound with respect to unobserved out-of-network care. The competing-risks framework depends on complete death ascertainment: deaths were identified from the TriNetX vital-status flag, which may under-capture out-of-network deaths, and any such under-capture would understate the competing hazard and bias the reported cumulative incidence upward. Loss to follow-up is treated as independent censoring, an assumption that cannot be verified in EHR data and that is violated if disengagement from the network is related to outcome; the direction of the resulting bias is not determinable from these data. The comorbidity strata overlap and are not mutually exclusive, so their estimates are marginal and their counts are not additive. Clinically attended arthritis captures only symptomatic, care-seeking, correctly coded disease and falls below radiographic prevalence estimates. Cells below the reporting threshold (n < 10) were suppressed. Because no comparison was tested and no adjustment applied, no statement about relative risk between patterns or strata is supported by these data.
CONCLUSION
This report provides absolute, fracture-pattern– and comorbidity-stratified competing-risks cumulative incidence of coded complications and secondary procedures after ankle ORIF at 90 days and at 2, 5, and 10 years, with death from any cause modeled as a competing event. In the no-comorbidity reference cohorts, 10-year cumulative incidence of conversion to arthrodesis/arthroplasty ranged from 0.48% to 1.62% and clinically attended arthritis from 17.10% to 20.20%; corresponding values for each comorbidity stratum, in which the competing-event burden was several-fold larger, are tabulated separately. These are unadjusted estimates from a single research network and support no comparison between patterns or strata, but they may serve as reference figures in preoperative counseling and as a basis for designing adjusted, morphology-resolved, patient-level studies.
Acknowledgments
None.
ETHICAL CONSIDERATIONS
This study used only de-identified, aggregated data and was deemed exempt from institutional review board review in accordance with institutional policy.
CONSENT TO PARTICIPATE
Not applicable. The study used de-identified, aggregated data; the requirement for informed consent was waived/not applicable.
CONSENT FOR PUBLICATION
Not applicable. No individual person’s data, images, or videos are included.
DECLARATION OF CONFLICTING INTEREST
The author(s) declared no potential conflicts of interest with respect to the research, authorship, and/or publication of this article.
DECLARATION OF ARTIFICIAL INTELLIGENCE USE
During preparation of this work the authors used a large language model (OpenAI GPT-4-class model) solely to assist with phrasing, organization, figure generation and grammar refinement of author-generated text. No content, data, analysis, were generated by the tool. The authors reviewed and verified all text and take full responsibility for the integrity and accuracy of the manuscript.
FUNDING
The author(s) received no financial support for the research, authorship, and/or publication of this article.
DATA AVAILABILITY
The data were obtained from the TriNetX Research Network under a data-use agreement and are not publicly available; qualified researchers may request access directly from TriNetX. The code lists used to define all cohorts and outcomes are provided in Supplementary Table 1.