
Introduction
Chronic back pain is unique in that it progresses in a temporal sequence from a pain-centric syndrome to functional impairment which inevitably results in a languishing mental state that reflects in a diminished quality of life (QOL).1–3 If the functional pain is bothersome and persistent enough, QOL plummets.4,5
There are several questionnaire instruments used to assess QOL in patients with chronic conditions such as lumbar discogenic pain associated with degenerative disc disease. One of the most widely tested and applied patient-reported outcome measures worldwide for assessing QOL is the EQ-5D. It has been translated into over 170 languages and national scoring algorithms exist for over 20 countries.6 The EQ-5D has been adopted for clinical trials, population health surveys, and health economic evaluations. It is the preferred instrument in 85% of national pharmacoeconomic guidelines for calculating quality-adjusted life years (QALYs).7,8
There has been a burgeoning interest in minimally invasive intradiscal interventions to address anterior column pain emanating from the degenerated intervertebral disc.9 The overall goal of these approaches is to restore homeostasis to the vertebral motion segment thereby preserving the long term health and biomechanics of the disc. Previous investigations suggest that intradiscal nucleus pulposus allograft offers durable benefits to patients with lumbar discogenic pain with respect to symptom amelioration and QOL improvement.10–12
Utilizing the findings from a randomized, double-blind sham-controlled trial of the safety and effectiveness of intradiscal nucleus pulposus allograft in patients with chronic lumbar discogenic pain, we evaluated the comparative degree of improvement in QOL at 3 months, the final blinded assessment prior to sham crossover, and at the 6-month primary study endpoint.
Patients and methods
Study Design and eligibility criteria
This was a randomized, double-blind, sham-controlled trial conducted at five interventional pain management clinics in Australia with a 24-month study duration. Patient reported outcomes were assessed at baseline as well as at 1, 3-, 6-, 12- and 24-months post procedure. This was a planned superiority trial, and the primary efficacy endpoint was specified a priori at 6 months post procedure. Details of the trial methodology, the CONSORT flow diagram, characterization of this study population, adverse events and the 6-month primary endpoint analysis findings have been published previously.13
Briefly, eligibility requirements were: 22 to 85 years of age, chronic axial midline low back pain of least 6 months duration, presence or absence of referred non-radicular leg pain, symptoms refractory to 3 months of conservative care, modified Pfirrmann grade 3-7 by magnetic resonance imaging (MRI) at 1 or 2 lumbar level(s), current back pain severity score of ≥ 40 to ≤ 90 mm by 100 mm visual analog scale (VAS), back functional impairment score of ≥ 40 to ≤ 80 by Oswestry Disability Index (ODI), intolerance to sitting for > 30 minutes, and positive pain provocation by sustained hip flexion maneuver on physical examination.
Ethical Considerations
All patients provided informed consent. The study was reviewed by the Bellberry Human Research Ethics Committee (HREC) in accordance with the National Health and Medical Research Council’s National Statement on Ethical Conduct in Human Research (2023) on 3 July, 2024 and approved on 13 September, 2024 with approval #2024-05-684. The trial was conducted in accordance with the Declaration of Helsinki and registered at ClinicalTrials.gov on 26 September 2024 (NCT06615505). The trial was externally monitored by an independent contract research organization and data were managed and analyzed by an independent statistical consulting firm. This trial is reported in accordance with the Consolidated Standards of Reporting Trials (CONSORT) guidelines.
Randomization and Blinding
Participants were randomized 1:1 to intradiscal nucleus pulposus allograft or an identical sham procedure using a permuted block design stratified by clinical site, after confirmation of eligibility and informed consent.
Participants, outcome assessors, clinicians completing follow-up examinations and study coordinators administering patient reported outcome measures were blinded to treatment assignment; only the investigator performing the procedure was unblinded. Full details of the randomization and blinding procedures have been published previously.13
At the 3-month follow-up interval, participants randomized to the sham control group who failed to achieve the minimal clinically important difference (MCID) of at least a 30% reduction in back pain severity were offered the option to cross over to open label treatment with allograft and unblinded. Participants in the allograft group or those with a 30% or greater reduction in back pain severity were informed that they did not meet the criteria for cross-over.
Procedures
The allograft procedure consisted of a single intradiscal injection of 100 mg of nucleus pulposus allograft (VIA Disc NP, Vivex Biologics, Inc., Miami, FL, USA), a lyophilized, terminally sterilized particulate (≤106 µm) processed from donated cadaveric disc tissue, reconstituted in sterile saline and delivered into the nucleus pulposus through a 20-gauge cannula under fluoroscopic guidance via a posterolateral approach, with local anesthesia and conscious sedation. The sham procedure was identical in setup, sedation protocol and duration, except that the cannula did not penetrate the annulus fibrosus and no intradiscal injection was performed. Sham participants who opted for cross-over at 3 months underwent the same allograft procedure and were followed unblinded for the remainder of the trial. Complete procedural details are provided in the primary trial report.13
Outcomes
Health related QOL was a secondary outcome and was assessed using the EQ-5D-5L. The EQ-5D-5L is a standardized, patient-reported instrument featuring 5 dimensions reflecting separate QOL components each with 5 levels of severity.14 The Australian-specific value set was used in this computation.
The descriptive system comprises the following dimensions: mobility, self-care, usual activities, pain/discomfort and anxiety/depression. The corresponding levels of severity are no problems (1), slight problems (2), moderate problems (3), severe problems (4) and extreme problems (5). The digits for the five dimensions are combined into a 5-digit number that describes the subject’s health state and expressed as a 5-digit code (e.g., 11111 = full health, 55555 = worst health). Each digit’s severity level (1-5) corresponds to a pre-calculated mathematical weight, which acts as a “penalty” that decreases the perfect health score of 1. In short, each dimension’s index number is the weight subtracted from perfect health when that dimension has a problem. When subjects improve and shift toward “no problems,” the mean decrement on each dimension shrinks toward zero — that is, it goes down.
The total EQ-5D-5L index value (utility score) is essentially 1 − Σ(decrements) − constant. As each of the five decrements falls, the total index value rises toward 1.0 (perfect health). These index values typically range from <0 (a health state considered worse than dead) to 1.0 (perfect health).
The second part of the questionnaire consists of a vertical VAS which records the participant’s perceived health from 0 (the worst imaginable health) to 100 (the best imaginable health).
Statistical analyses
For each of the five EQ-5D-5L dimensions, summary statistics were derived, including numbers of participants and proportions of categorical responses for the five severity levels at each follow-up interval by study group. Converted index values for each dimension were summarized at each follow-up interval using descriptive statistics (mean, standard deviation). Additionally, the change from baseline (95% CIs) at 3 months (the final blinded assessment prior to sham crossover) and at the 6-month primary endpoint in each dimension was compared between study groups using the two-sided Wilcoxon rank sum test.
The mean total index values (utility scores) and the mean VAS scores were also compared between groups at each follow-up interval. The between-group change from baseline (95% CIs) at 3 and 6 months for the utility and VAS scores were compared using the two-sided Wilcoxon rank sum test. P values for all between-group comparisons were derived from the Wilcoxon rank sum test. The accompanying 95% CIs for the between-group difference in mean change from baseline were calculated using the normal approximation (difference in means ± 1.96 times its standard error) and are presented to convey the magnitude and precision of the mean difference; they are not derived from the rank-based test. Medians of change from baseline are presented alongside the means in Table 2. Because the dimension-level index decrements are discrete, bounded at zero and strongly right skewed, with the modal response (no problems) corresponding to a decrement of zero, the median change is zero for most dimension-level comparisons and is uninformative; means (SD) are therefore used in the text, which also permits direct comparison with published population norms that are reported as means. For all comparisons, effect sizes were calculated using Cohen’s d statistic. Effect size thresholds reflecting the magnitude of the difference between groups were 0.2 (small), 0.5 (medium), 0.8 (large), and 1.3 (very large).15
For the primary 6-month endpoint analysis, all randomized participants were analyzed according to their originally assigned treatment groups using strict intention to treat (ITT) analysis, regardless of any cross-over or deviations from the protocol. Missing values were imputed using last observation carried forward (LOCF). Accordingly, for sham participants who crossed over to allograft at 3 months, the 3-month assessment was the last observation obtained under the randomized assignment and was carried forward to the 6-month primary endpoint; post-crossover observations were not attributed to the sham group. Because the 3-month interval was the final assessment at which both groups remained blinded and all values were observed rather than imputed, between-group results at 3 months are presented alongside those at the 6-month primary endpoint.
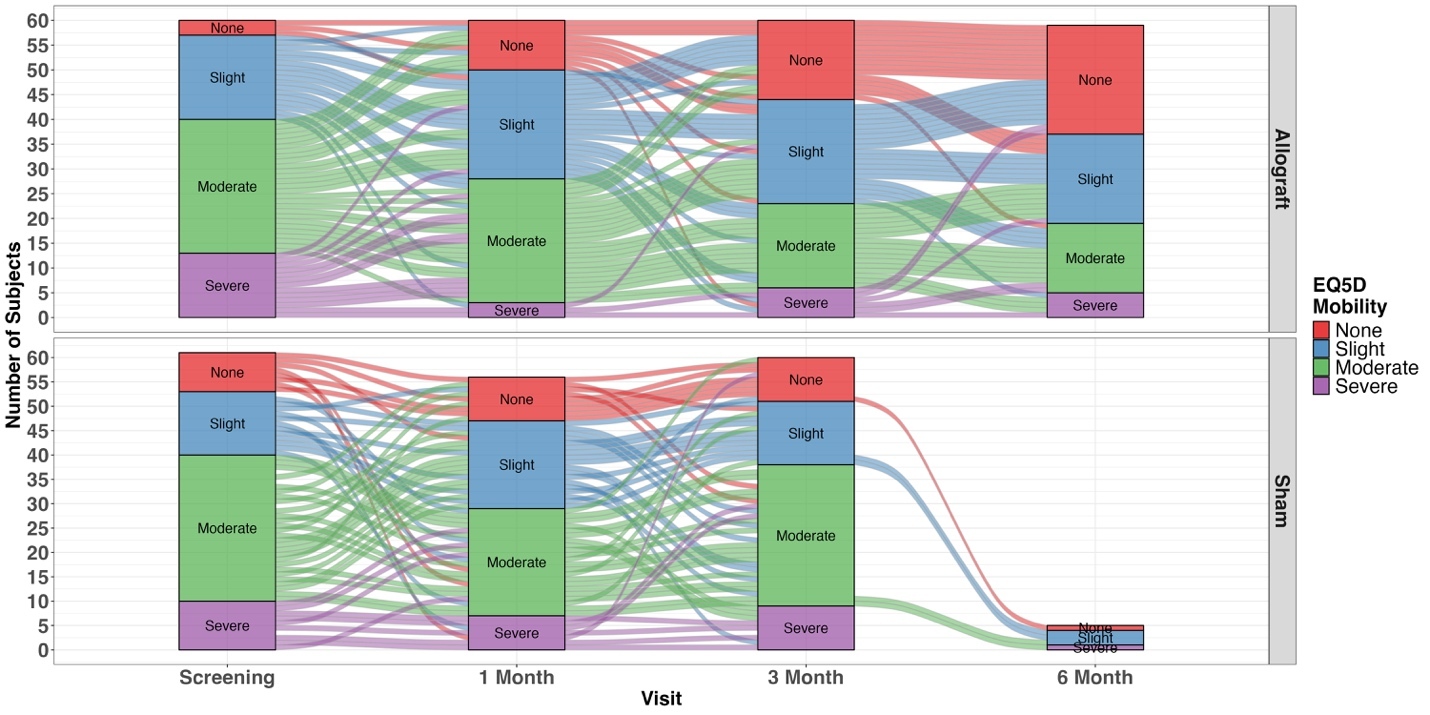
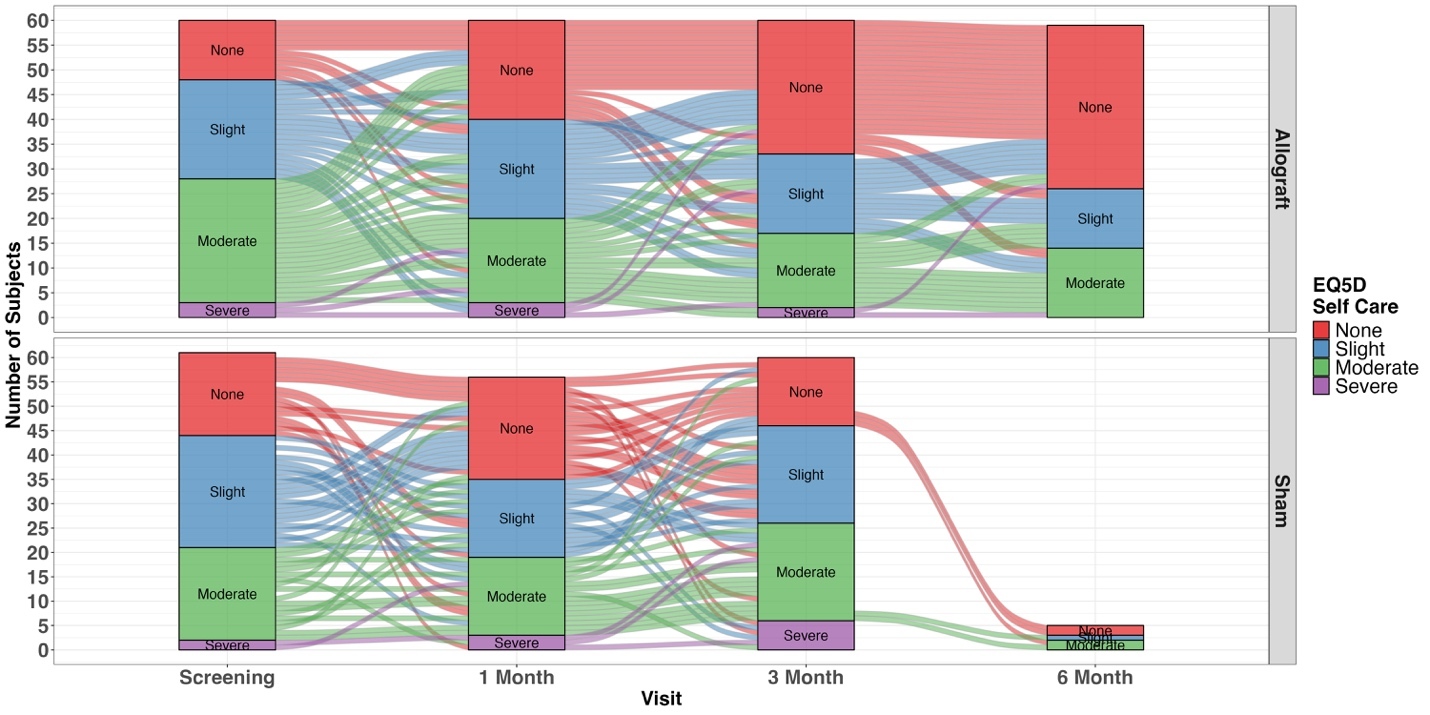
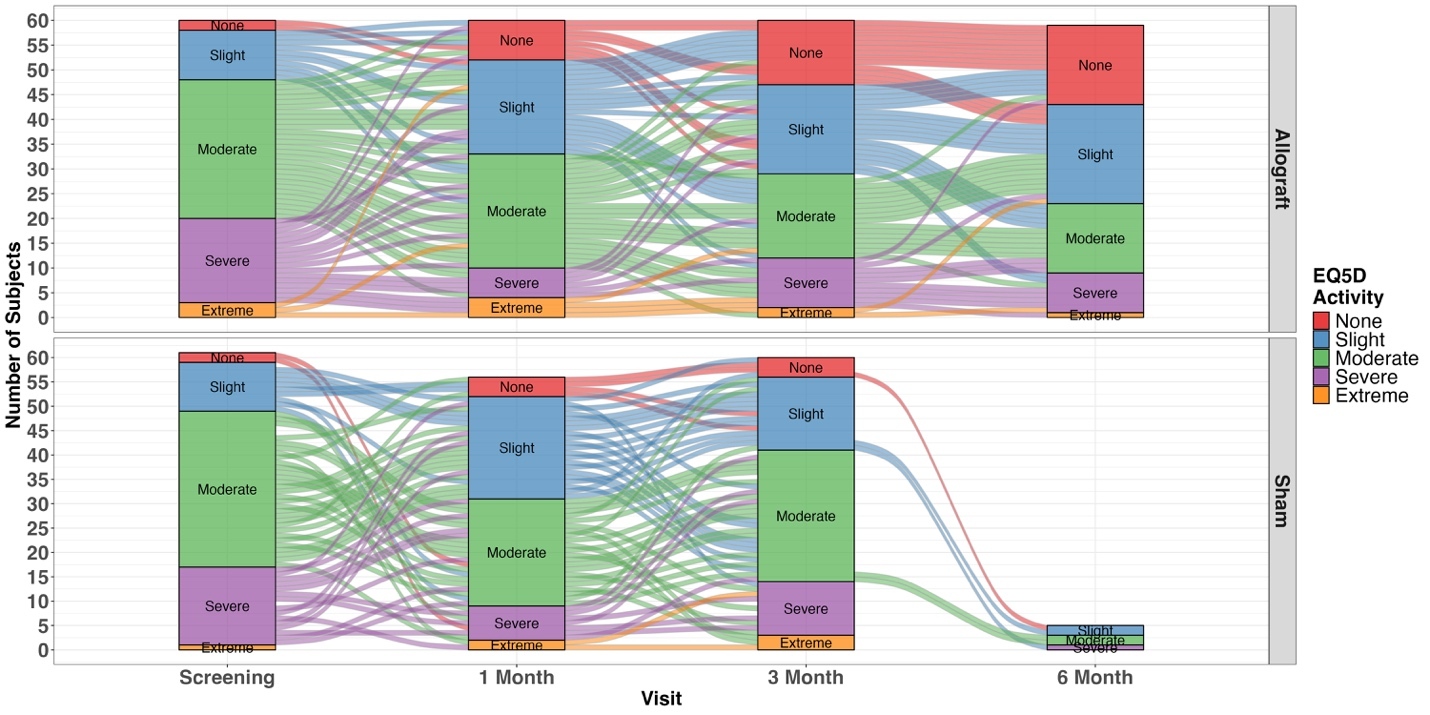
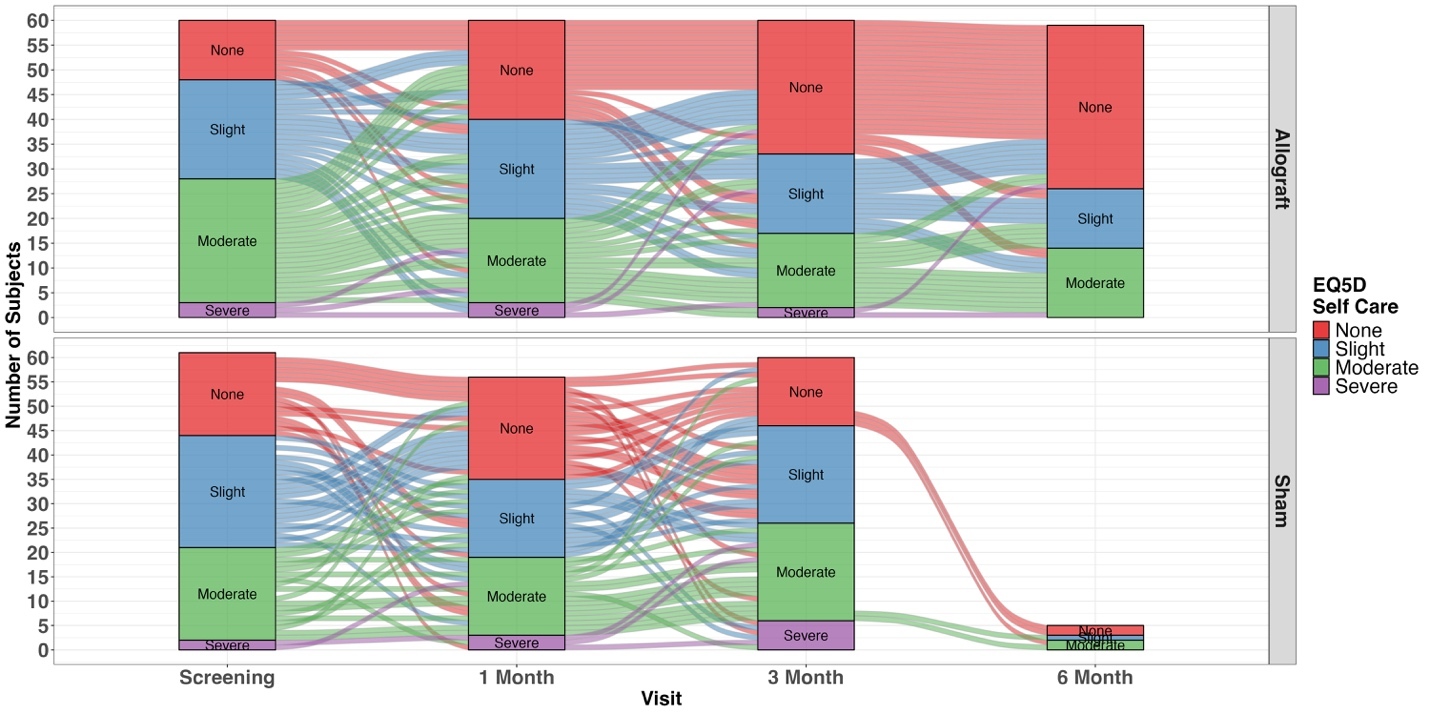
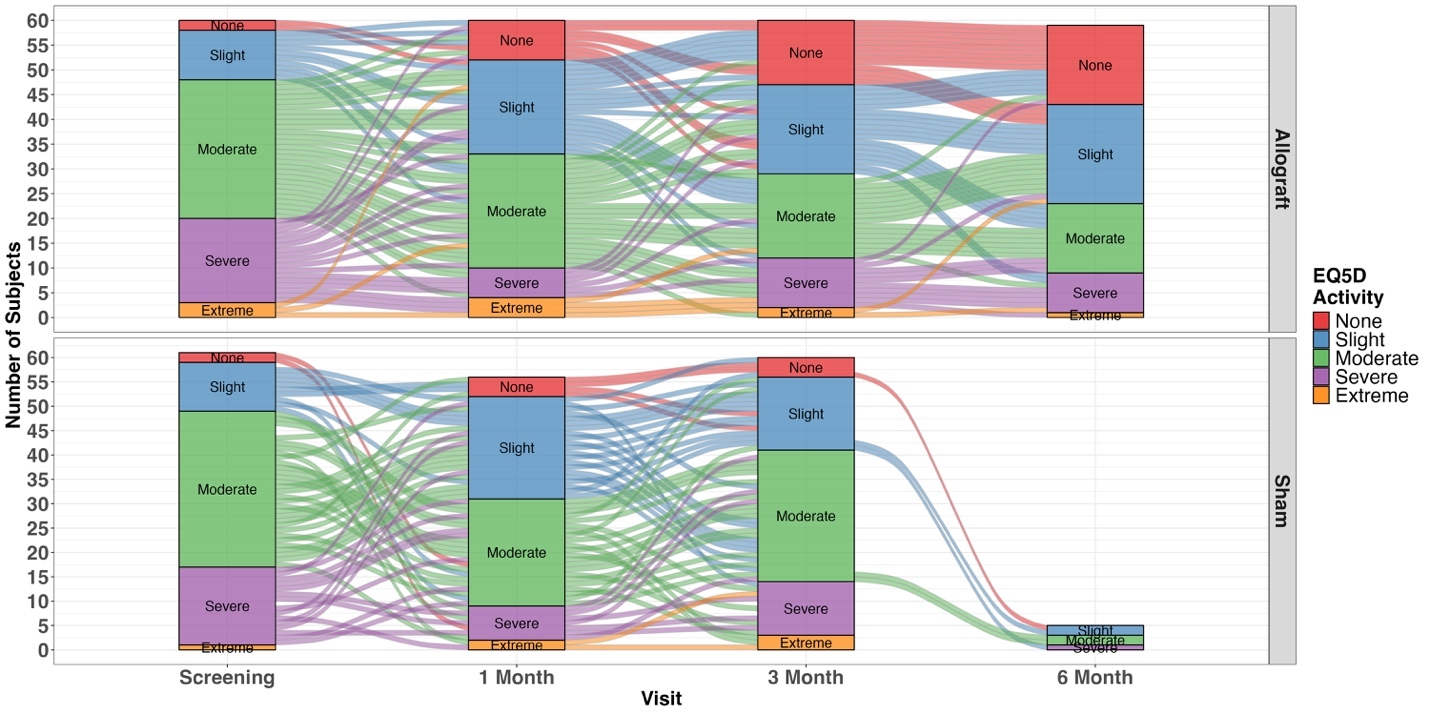
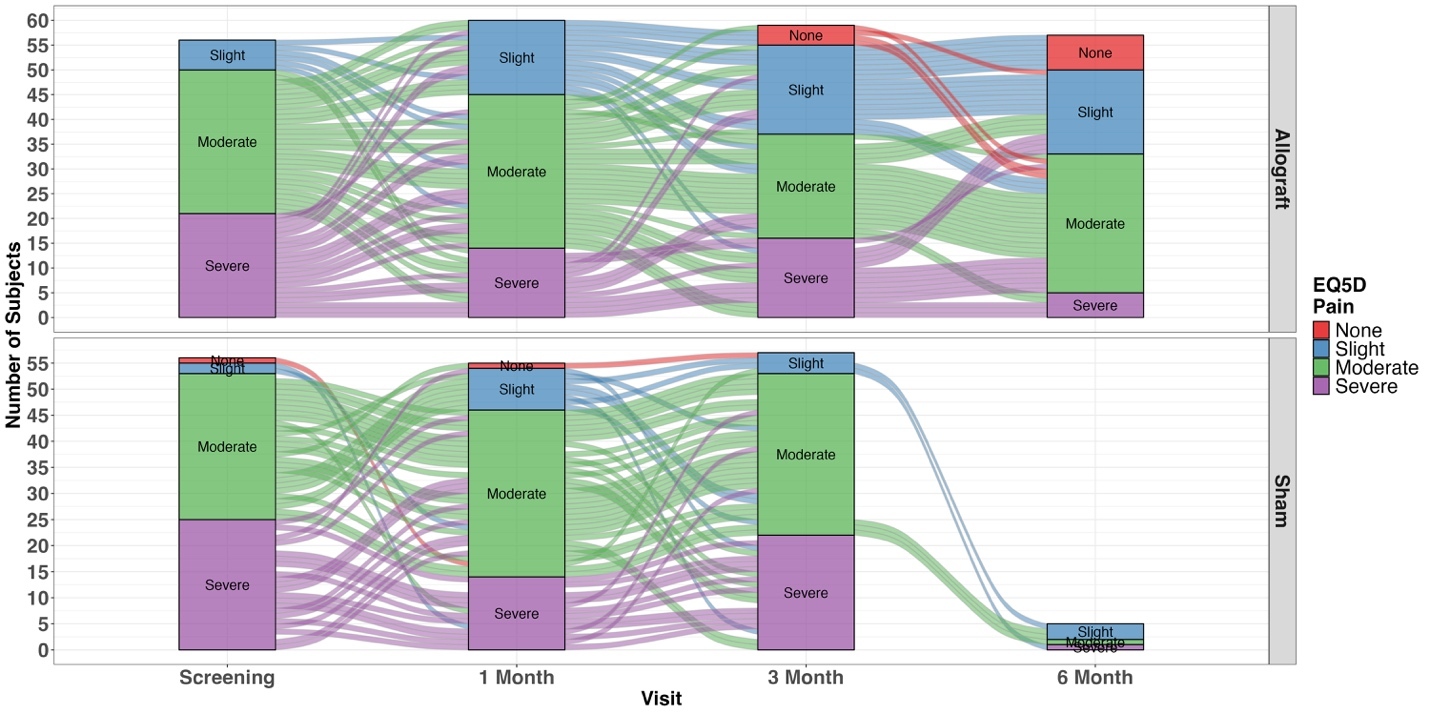
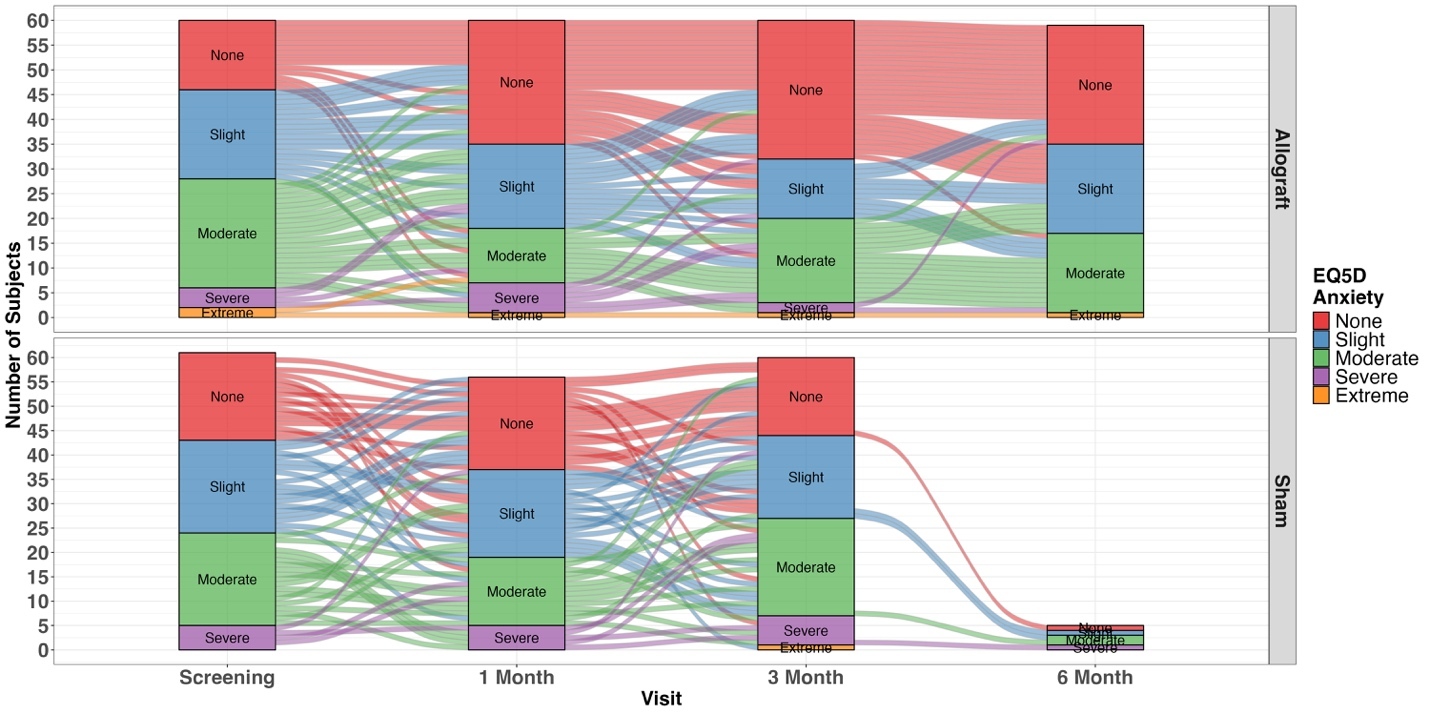
Individual QOL dimension data were displayed graphically using alluvial plots which are specialized, flow-based visualizations designed for multi-dimensional categorical data, using stacked bars (strata) and connecting ribbons (alluvia) to show changes in study group composition across time.
Results
This trial evaluated 210 adults for eligibility; 89 failed to meet one or more basic inclusion or exclusion criteria and 121 adults were enrolled and randomly assigned to receive either nucleus pulposus allograft (60 participants, 92 discs treated) or a sham procedure (61 participants, 91 discs treated). Post procedure follow-up rates were high with 118 (97.5%) participants at 1 month, 120 (99%) at 3 months, and 119 (98%) at the 6-month primary endpoint. Baseline characteristics by study group are provided in Table 1.
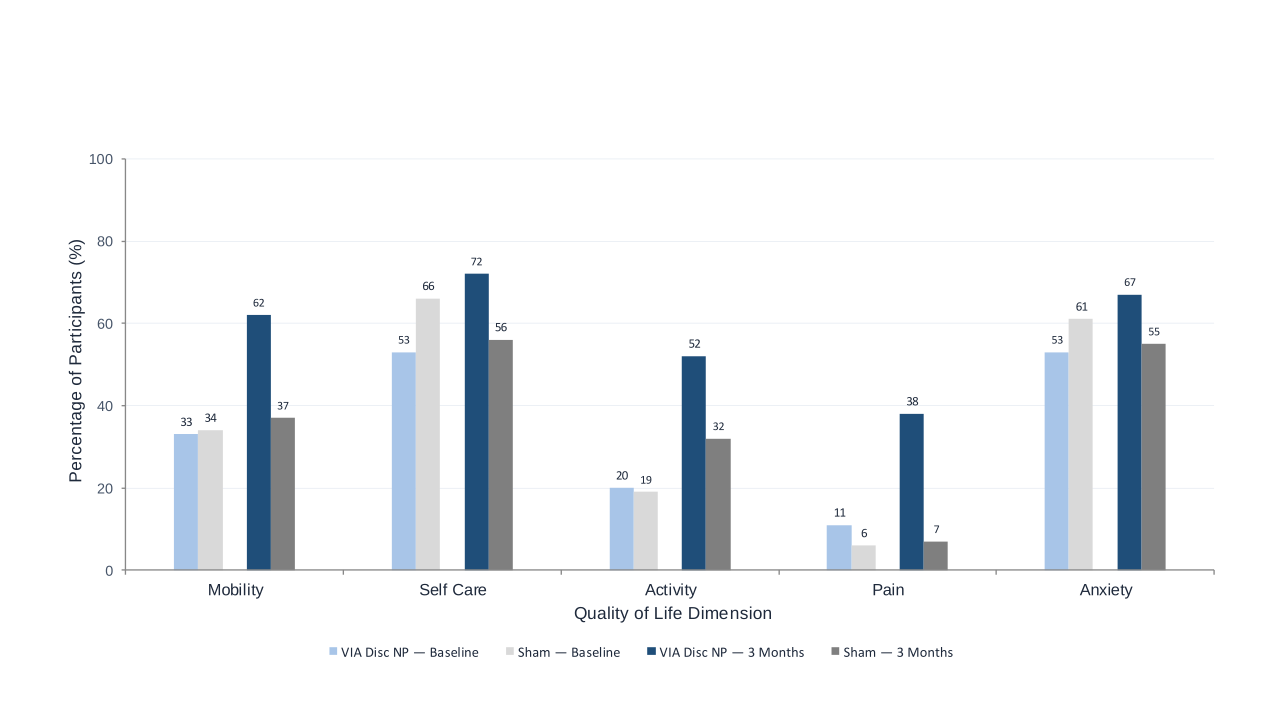
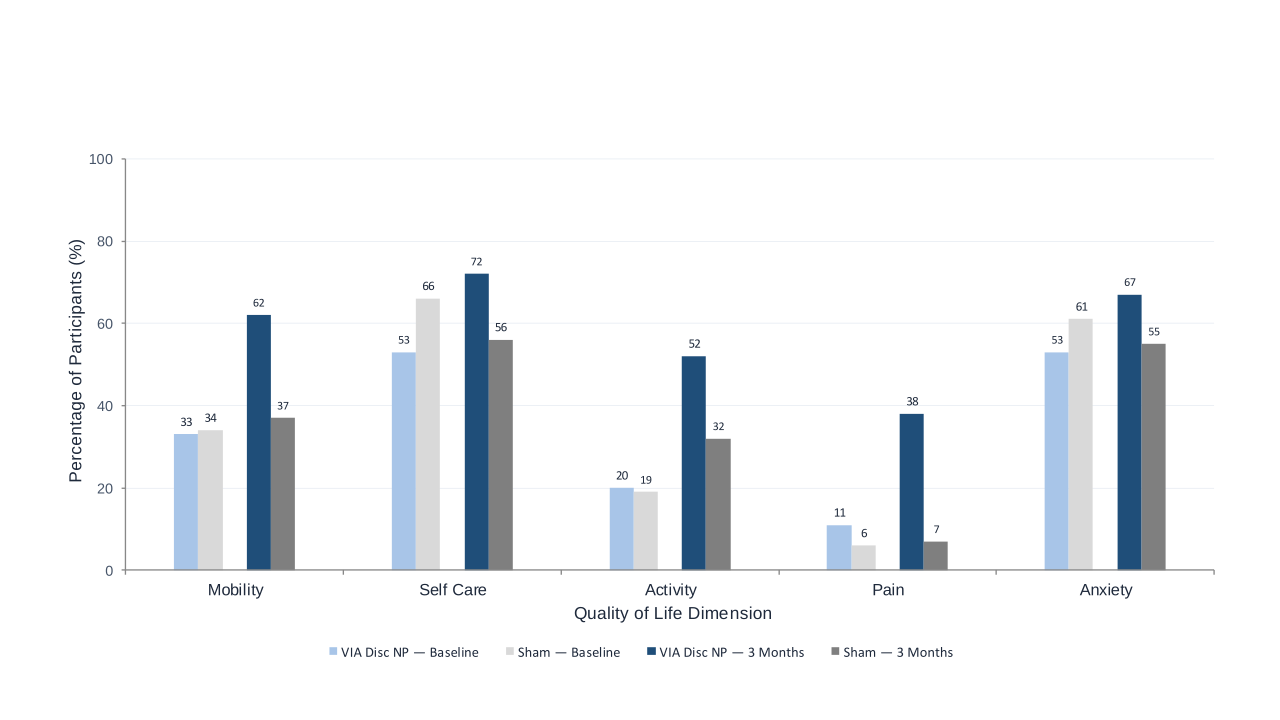
Fifty-seven (93%) sham participants failed to achieve the back pain MCID at 3 months post procedure, with 55 (90% of the sham group) opting to cross over to intradiscal allograft treatment. Thus, in the ITT analysis, the 3-month results for these participants were carried forward (LOCF) to the 6-month primary endpoint, and the 3-month assessment represents the final blinded comparison of the randomized groups based entirely on observed data. Between-group differences in change from baseline at 3 and 6 months for all EQ-5D measures are summarized in Table 2. Figure 1 provides an overall comparison of the percentage of participants by study group reporting no or slight problems across the five EQ-5D dimensions at baseline and at the 3-month follow-up interval prior to sham crossover. Study groups were generally similar at baseline across all five dimensions. In contrast, at 3 months post procedure, there were substantially larger proportions of allograft participants reporting no or slight problems particularly for mobility, activity and pain with improvements of 1.9-, 2.6-, and 3.5-fold over baseline, respectively.
Mobility
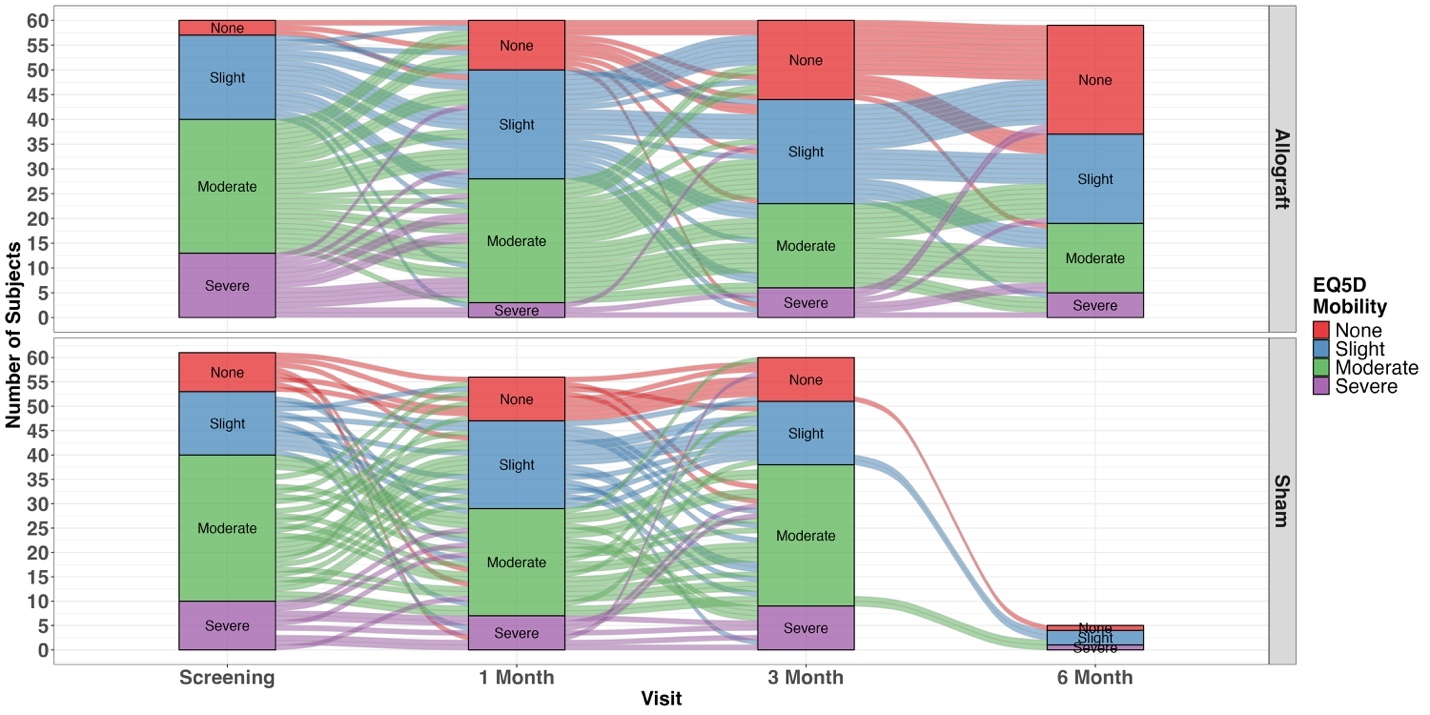
For the mobility dimension, mean index values for the allograft group showed steady longitudinal improvement, decreasing from 0.093 (0.078) at baseline to 0.054 (0.049), 0.056 (0.066), and 0.048 (0.063) at 1-, 3- and 6-months post procedure. In comparison, mean index values for the sham group showed no improvement over the baseline value of 0.080 (0.074) with follow-up values of 0.071 (0.069), 0.076 (0.071) and 0.079 (0.074) at 1-, 3 and 6-months, respectively. At 3 months, prior to sham crossover, the between-group difference in change from baseline was 0.032 (95% CI, 0.005 – 0.060; P=0.002; effect size, 0.4) in favor of allograft (Table 2). The group difference in change from baseline at the 6-month primary endpoint was 0.043 (95% CI, 0.016 – 0.071; P<0.001) with a corresponding effect size of 0.6 reflecting a medium treatment effect in favor of allograft. Figure 2 provides a visual representation of the longitudinal data distribution by study group for the mobility dimension.
Self-care
For the self-care dimension, the mean index values in the allograft group also showed steady improvement post procedure: 0.045 (0.045), 0.037 (0.047), 0.030 (0.042), and 0.020 (0.024) at baseline, 1-, 3- and 6-months, respectively. In contrast, sham participants showed a worsening over time for self-care: 0.036 (0.040), 0.035 (0.047), 0.050 (0.058), and 0.051 (0.058) at the same intervals. At 3 months, prior to sham crossover, the between-group difference in change from baseline was 0.029 (95% CI, 0.007 – 0.052; P=0.002; effect size, 0.5) in favor of allograft (Table 2). The group difference in change from baseline at the 6-month primary endpoint was 0.039 (95% CI, 0.019 – 0.060; P<0.001) with a corresponding effect size of 0.7 reflecting a medium treatment effect in favor of allograft. Figure 3 provides a visual representation of the longitudinal data distribution by study group for the self-care dimension.
Usual activities
For the usual activities dimension, mean index values in the allograft group decreased from 0.080 (0.062) at baseline to 0.048 (0.057), 0.048 (0.062), and 0.038 (0.057) at 1-, 3- and 6-months post procedure. In the sham group, comparable values were 0.074 (0.059) at baseline, and 0.051 (0.058), 0.062 (0.060), and 0.065 (0.061) at each follow-up interval. At 3 months, prior to sham crossover, the between-group difference in change from baseline of 0.020 (95% CI, −0.005 – 0.045; P=0.068; effect size, 0.3) favored allograft but did not reach statistical significance (Table 2). The group difference in change from baseline at the 6-month primary endpoint was 0.033 (95% CI, 0.006 – 0.059; P=0.008) with a corresponding effect size of 0.4 reflecting a small treatment effect in favor of allograft. Figure 4 provides a visual representation of the longitudinal data distribution by study group for the usual activities dimension.
Pain/discomfort
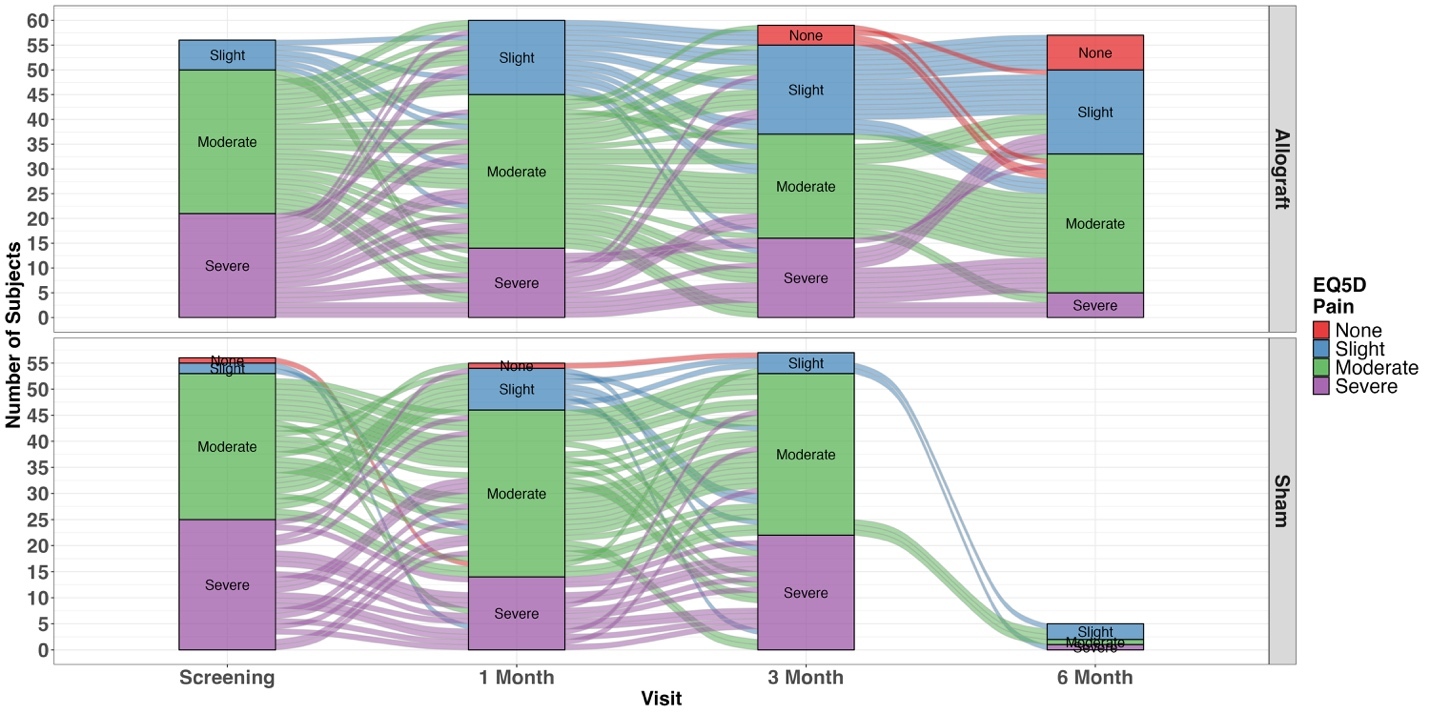
For the pain/discomfort dimension, mean index values decreased from 0.15 (0.099) at baseline to 0.12 (0.090), 0.12 (0.10), and 0.084 (0.075) at each follow-up interval. Comparable values for the sham group were 0.17 (0.10), 0.13 (0.096), 0.16 (0.099), and 0.16 (0.10). At 3 months, prior to sham crossover, the between-group difference in change from baseline of 0.012 (95% CI, −0.033 – 0.057; P=0.115; effect size, 0.1) favored allograft but did not reach statistical significance (Table 2). The group difference in change from baseline at the 6-month primary endpoint was 0.050 (95% CI, 0.004 – 0.096; P=0.002) with a corresponding effect size of 0.4 reflecting a small treatment effect in favor of allograft. Figure 5 provides a visual representation of the longitudinal data distribution by study group for the pain/discomfort dimension.
Anxiety/depression
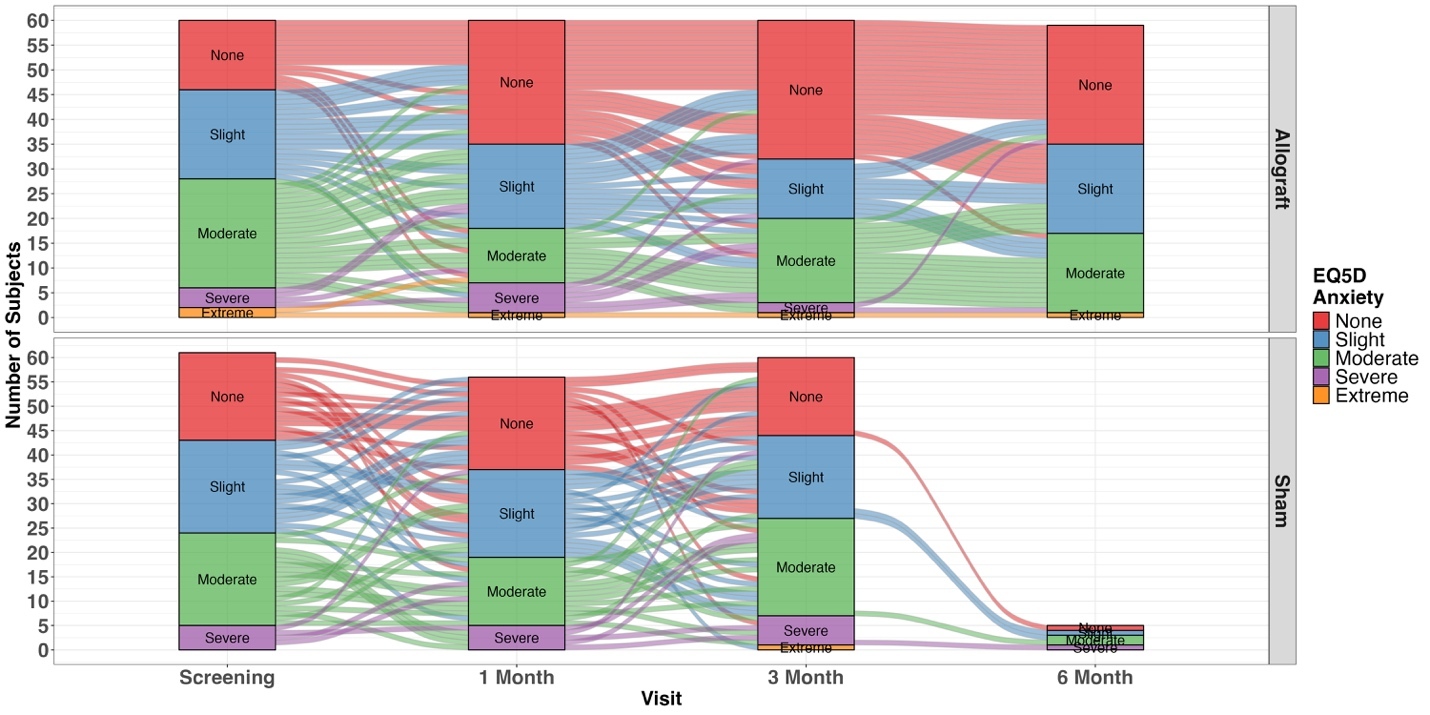
As with the other EQ-5D dimensions, the mean index values for the anxiety/depression dimension in the allograft group showed steady improvement post procedure: 0.058 (0.066), 0.049 (0.073), 0.037 (0.054), and 0.032 (0.038) at baseline, 1-, 3- and 6-months, respectively. In contrast, sham participants showed a worsening over time for anxiety/depression: 0.050 (0.062), 0.050 (0.068), 0.059 (0.070), and 0.060 (0.070) at the same intervals. At 3 months, prior to sham crossover, the between-group difference in change from baseline was 0.030 (95% CI, 0.003 – 0.056; P=0.006; effect size, 0.4) in favor of allograft (Table 2). The group difference in change from baseline at the 6-month primary endpoint was 0.035 (95% CI, 0.009 – 0.061; P=0.002) with a corresponding effect size of 0.5 reflecting a medium treatment effect in favor of allograft. Figure 6 provides a visual representation of the longitudinal data distribution by study group for the anxiety/depression dimension.
Summary Index
At baseline, both study groups exhibited substantially depressed mean utility scores relative to a perfect health score of 1.0: allograft, 0.585 (0.243), sham, 0.608 (0.219). Post procedure the study groups demonstrated divergent therapeutic trajectories. Allograft participants showed continual longitudinal quality of life improvement of 0.695 (0.249), 0.714 (0.238), and 0.788 (0.196) at 1-, 3-, and 6-months, respectively. In contrast, overall quality of life diminished among sham participants with mean follow-up values of 0.685 (0.243), 0.604 (0.241), and 0.595 (0.244) at the same follow-up intervals. At 3 months, prior to sham crossover, mean utility scores had improved by 0.129 in the allograft group and declined by 0.004 in the sham group, a between-group difference in change from baseline of 0.132 (95% CI, 0.038 – 0.227; P=0.003; effect size, 0.5) in favor of allograft (Table 2). The group difference in change from baseline at the 6-month primary endpoint was 0.215 (95% CI, 0.119 – 0.311; P<0.001) with a corresponding effect size of 0.8 reflecting a large overall treatment effect for quality of life in favor of allograft.
Visual Analog Scale
As with the overall utility index, participants perceived health varied markedly by study group. Allograft participants experienced steady improvement, increasing from 59.47 (21.66) at baseline to 68.65 (19.7), 69.36 (20.17), and 68.90 (20.70) at 1-, 3-, and 6-months, respectively. Sham participants VAS values worsened from 59.74 (17.48) at baseline to 61.85 (18.32), 55.54 (21.16), and 55.61 (20.97) at the same follow-up intervals. At 3 months, prior to sham crossover, VAS values had improved by 9.90 in the allograft group and declined by 4.20 in the sham group, a between-group difference in change from baseline of 14.10 (95% CI, 5.51 – 22.68; P<0.001; effect size, 0.6) in favor of allograft (Table 2). The group difference in change from baseline at the 6-month primary endpoint was 13.56 (95% CI, 5.49 – 21.64; P<0.001) with a corresponding effect size of 0.6 reflecting a medium treatment effect for perceived health in favor of allograft.
Sham Crossover Participants
Sham participants who crossed over to open label allograft treatment at the 3-month follow-up interval experienced similar quality of life improvements as participants in the original blinded allograft arm. For example, mean utility scores improved from 0.590 (0.244) at the point of crossover to 0.782 (0.198) at 3 months post crossover. Similarly, mean VAS values of perceived health increased from 54.7 (21.1) to 67.4 (19.5) over the same period of observation.
Discussion
There is a dearth of published literature regarding the impact of chronic lumbar discogenic pain on health related QOL as most studies have focused on pain severity and back function as primary endpoints.9,16,17 The current randomized controlled trial demonstrated that, compared to a sham procedure, a single intradiscal injection of nucleus pulposus allograft provides statistically significant improvement across all five dimensions of the EQ-5D as well as the overall utility index and VAS at the 6-month primary endpoint, with significant between-group separation in favor of allograft already evident at the 3-month blinded assessment prior to sham crossover for the utility index, VAS, mobility, self-care and anxiety/depression. Together, the findings show that the EQ-5D assesses important aspect of health in chronic low back pain and that QOL can be modified by an effective intradiscal intervention.18–20
Study participants presented with substantially diminished QOL at the time of enrollment with baseline mean utility index values of 0.585 and 0.608 and mean VAS values of 59.47 and 59.74 for allograft and sham study groups, respectively. In sharp contrast, reported normative values for the Australian population ranged from 0.86 to 0.92 for the utility index and from 73.2 to 78.9 for the VAS.21–23 By the 6-month follow-up interval, the mean utility index and VAS values rose to 0.788 and 68.90, respectively, following the intradiscal allograft procedure suggesting a return to near normal QOL. Although follow-up is limited to 3 months, sham participants who crossed over to allograft treatment experienced a similar level of improvement in QOL.
The healthy nucleus pulposus acts as a hydraulic cushion that absorbs and dissipates axial force, effectively providing a damping effect on compressive loading.24,25 Therefore, to avoid the inevitable diminution in mechanical integrity associated with degeneration, preservation of the healthy disc becomes paramount. Replenishing degenerated disc tissue with nucleus pulposus allograft represents a direct homologous tissue transfer that may restore the cushioning characteristics of the disc.26 Unlike attempts to induce chondrogenic regeneration within the disc, supplementation with nucleus pulposus allograft relies on the intrinsic homology of the tissue in terms of structure, function and composition to afford therapeutic benefits by mimicking its original biomechanical role.
A limitation to the analysis of a secondary outcome such as QOL is the interdependence of 6-month data availability on the sham participant < 30% MCID back pain cross over criterion at the 3-month follow-up interval. Ninety percent of sham participants qualified and opted for cross over at 3 months based on their back pain results. Consequently, in the prespecified ITT analysis, the 6-month QOL values for these participants were their 3-month values carried forward (LOCF), which accounts for the near identical sham group values at 3 and 6 months. Two consequences follow. First, the 6-month between-group differences reflect continued observed improvement in the allograft group between 3 and 6 months against sham values that were, by construction, unchanged from 3 months, and the 6-month estimates should be interpreted accordingly. Second, the 3-month comparison, at which both groups remained blinded, and all values were observed, provides the most direct comparison of the randomized groups. At 3 months the between-group differences favored allograft for every measure and were statistically significant for the utility index, VAS, mobility, self-care and anxiety/depression, but not for usual activities (P=0.068) or pain/discomfort (P=0.115) (Table 2). The larger 6-month differences for these two dimensions therefore derive from continued improvement in the allograft group that could not be compared against concurrently observed sham data, and the 3-month estimates should be regarded as the more conservative estimate of the treatment effect on QOL. A thorough discussion of the general study limitations including the placebo response as well as the low risk safety profile have been published previously.13
Conclusions
The results of this randomized controlled trial demonstrate that intradiscal delivery of nucleus pulposus allograft provides statistically superior QOL improvement compared to a sham procedure with significant between-group differences in favor of allograft for the utility index and VAS at the 3-month blinded assessment prior to sham crossover and across all EQ-5D measures at the 6-month primary endpoint. The associated effect sizes for symptomatic improvement were of medium magnitude reflecting substantial QOL recovery to levels approaching normative population values.
Authors’ contributions
Concept and design: P.V., V.M., J.Y., M.G., D.B., H.M., J.B., M.R. Acquisition, analysis, and interpretation of data: P.V., J.B., M.R. Drafting of the manuscript: P.V., J.B. Critical revision of the manuscript for important intellectual content: V.M., J.Y., M.G., D.B., H.M., M.R. Statistical analysis: P.V., J.B. Administrative, technical, or material support: P.V. Supervision: P.V., V.M., J.Y., M.G., M.R. All authors reviewed and approved the final manuscript.
Competing interests
P.V. received funding for trial conduct, study supplies and article processing charges from the sponsor (Vivex Biologics, Inc.). J.B. is an employee of Vivex Biologics, Inc. The other authors report no competing interests.
Funding
Financial support for the research, authorship, and/or publication of this article was provided by Vivex Biologics, Inc. (Miami, FL, USA).
Acknowledgments
The authors are most grateful to independent on-site clinical research associate, Mr. Lachlan Porter, and study manager, Ms. Nicolette Vega, for efficient execution of this trial (Moxie Clinical, San Francisco, CA, USA). We also are in debt to our independent biostatistical consultants, Mr. Alex Breno and Mr. David Maislin (Biomedical Statistical Consultants, Philadelphia, PA, USA). We thank Dr. Morgan Lorio for serving as medical monitor for this trial. Dr. Timothy Ganey provided expert review and thoughtful recommendations for this manuscript.