
Introduction
Proximal humerus fractures (PHFs) account for approximately 4% to 6% of adult fractures and are among the most common fragility fractures in older adults.1–3 Open reduction and internal fixation (ORIF) remains an important treatment option for selected patients, but complications include fixation failure, infection, reoperation, and medical adverse events.4–9 Postoperative risk therefore extends beyond fracture healing and implant stability to unplanned care after discharge.
Metabolic and bariatric surgery (MBS) can produce persistent changes in bone and nutritional health, including impaired calcium and vitamin D absorption, bone loss, protein and micronutrient deficiencies, and other metabolic consequences.10–15 Alcohol use disorder may also become more common after some bariatric procedures.16 These factors may influence both skeletal recovery and postoperative medical risk. Fracture risk is also higher after MBS, which makes fixation of fractures in this population a clinically relevant scenario.13
Prior MBS has been associated with increased complications after shoulder arthroplasty independent of body mass index (BMI),17 while findings in other orthopedic populations have been mixed.18–21 Outcomes after PHF fixation remain poorly characterized. Because severe obesity may itself influence perioperative risk, patients with documented severe obesity without MBS provide a clinically relevant comparison group. This comparison approximates the underlying population from which patients undergoing MBS arise, and therefore asks whether prior surgery is associated with different postoperative outcomes than the underlying disease alone.
We used a national all-payer readmissions database to compare outcomes after inpatient PHF ORIF in patients with prior MBS and documented severe obesity without MBS. The primary outcome was unplanned readmission at 30, 90, and 180 days. Medical and fracture-specific complications were secondary outcomes. We hypothesized that prior MBS would be associated with higher readmission and complication rates and examined causes of readmission to characterize postoperative risk.
Materials and Methods
Ethical Considerations
The Nationwide Readmissions Database (NRD) contains deidentified discharge records and was used in accordance with the Healthcare Cost and Utilization Project (HCUP) Data Use Agreement. Formal institutional review board review was not required because this study used deidentified administrative data and did not constitute human subjects research. Informed consent was not required because no identifiable patient information was available to the investigators. Data were accessed and analyzed in accordance with HCUP data-security and confidentiality requirements. In accordance with HCUP reporting requirements, cell counts of 1 to 10 patients were suppressed.
Data Source
This retrospective cohort study used the HCUP NRD from 2016 through 2022.22 The NRD is an all-payer discharge database with patient linkage across hospitals within the same state and calendar year and survey weights supporting national estimates. Reporting followed the Strengthening the Reporting of Observational Studies in Epidemiology statement.23
Study Population
We identified adults with an initial-encounter proximal humerus fracture who underwent open reduction and internal fixation during the same hospitalization. The primary ORIF cohort was identified using International Classification of Diseases, Tenth Revision, Procedure Coding System (ICD-10-PCS) codes 0PSC04Z or 0PSD04Z. Patients treated with intramedullary fixation without one of these ORIF codes were excluded from the primary cohort but retained in the supporting all-fixation analysis.
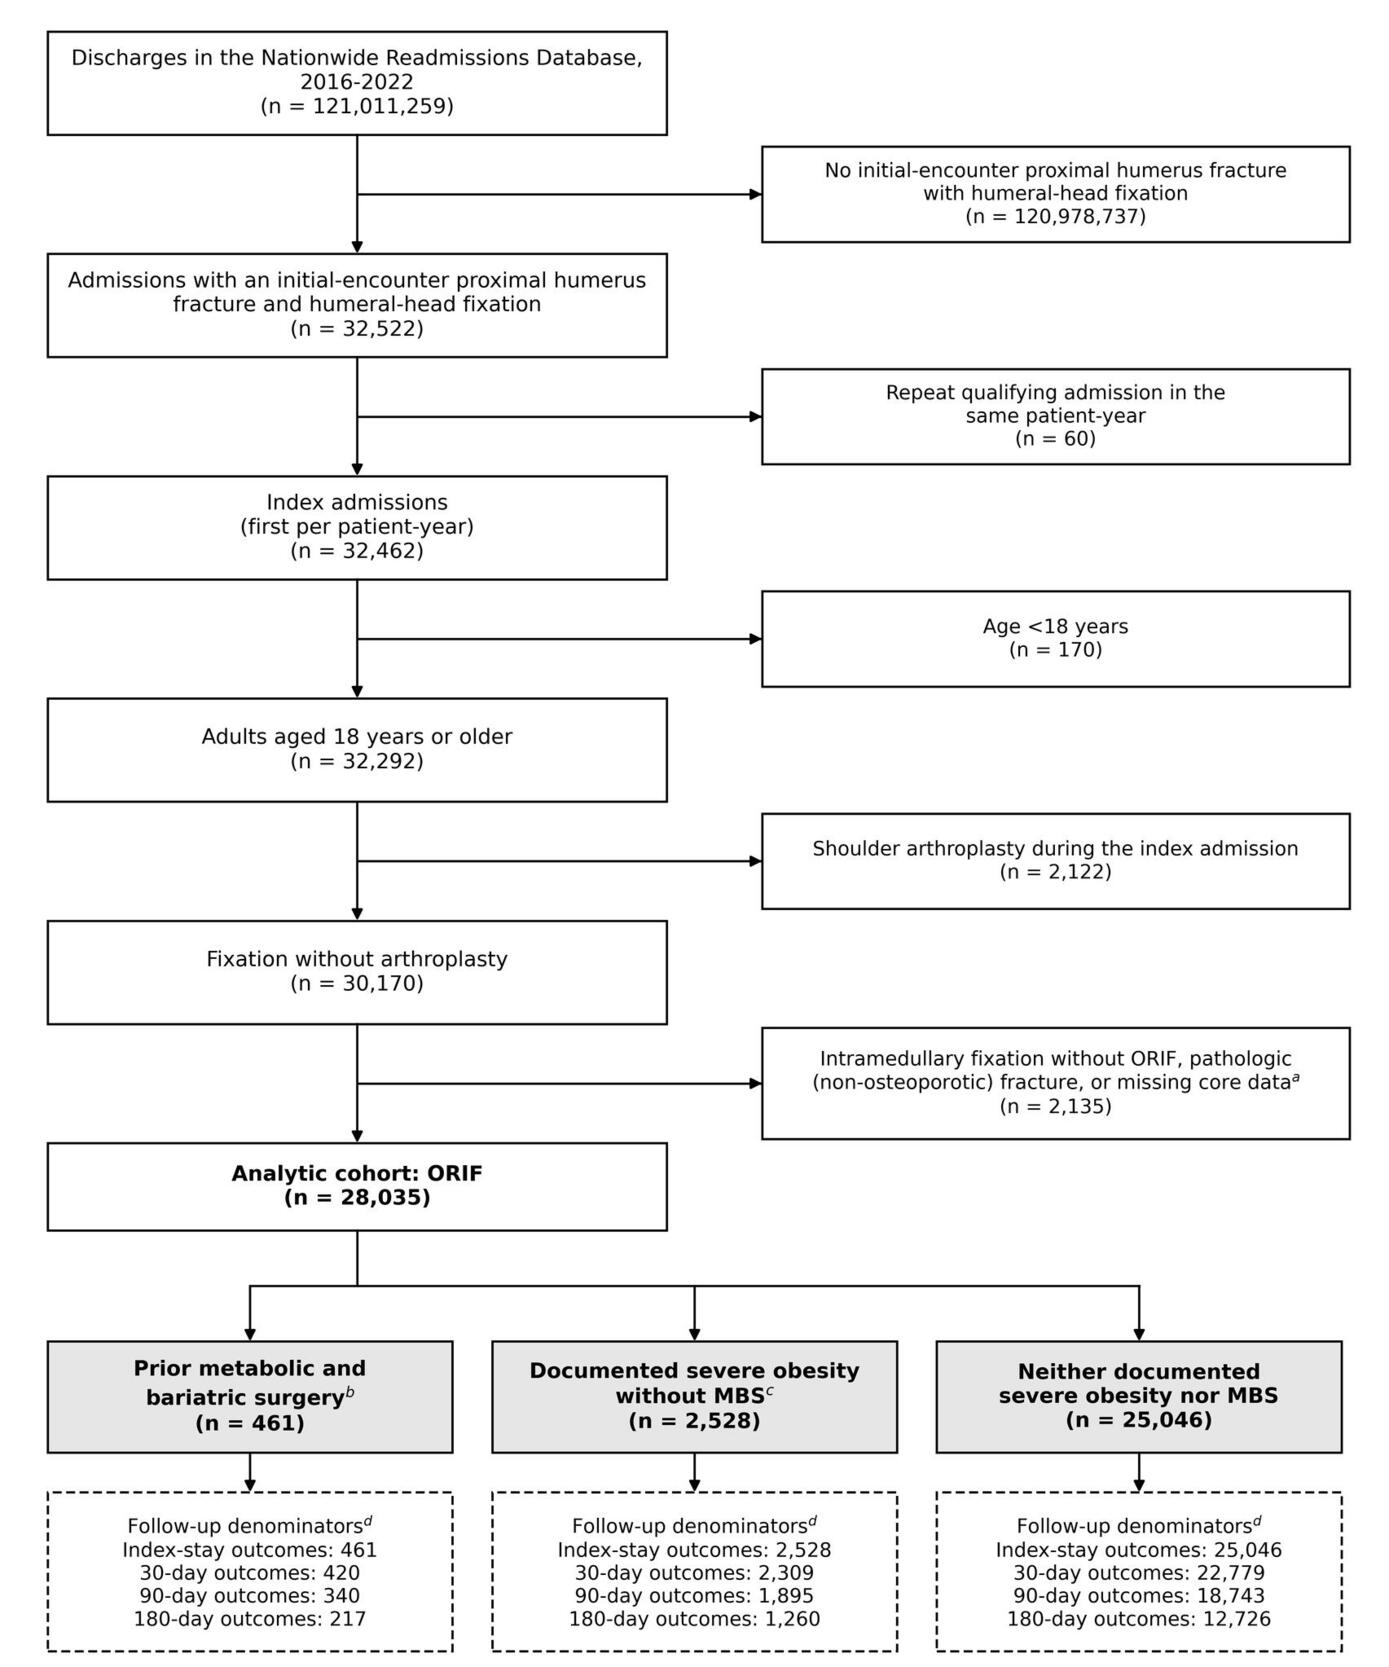
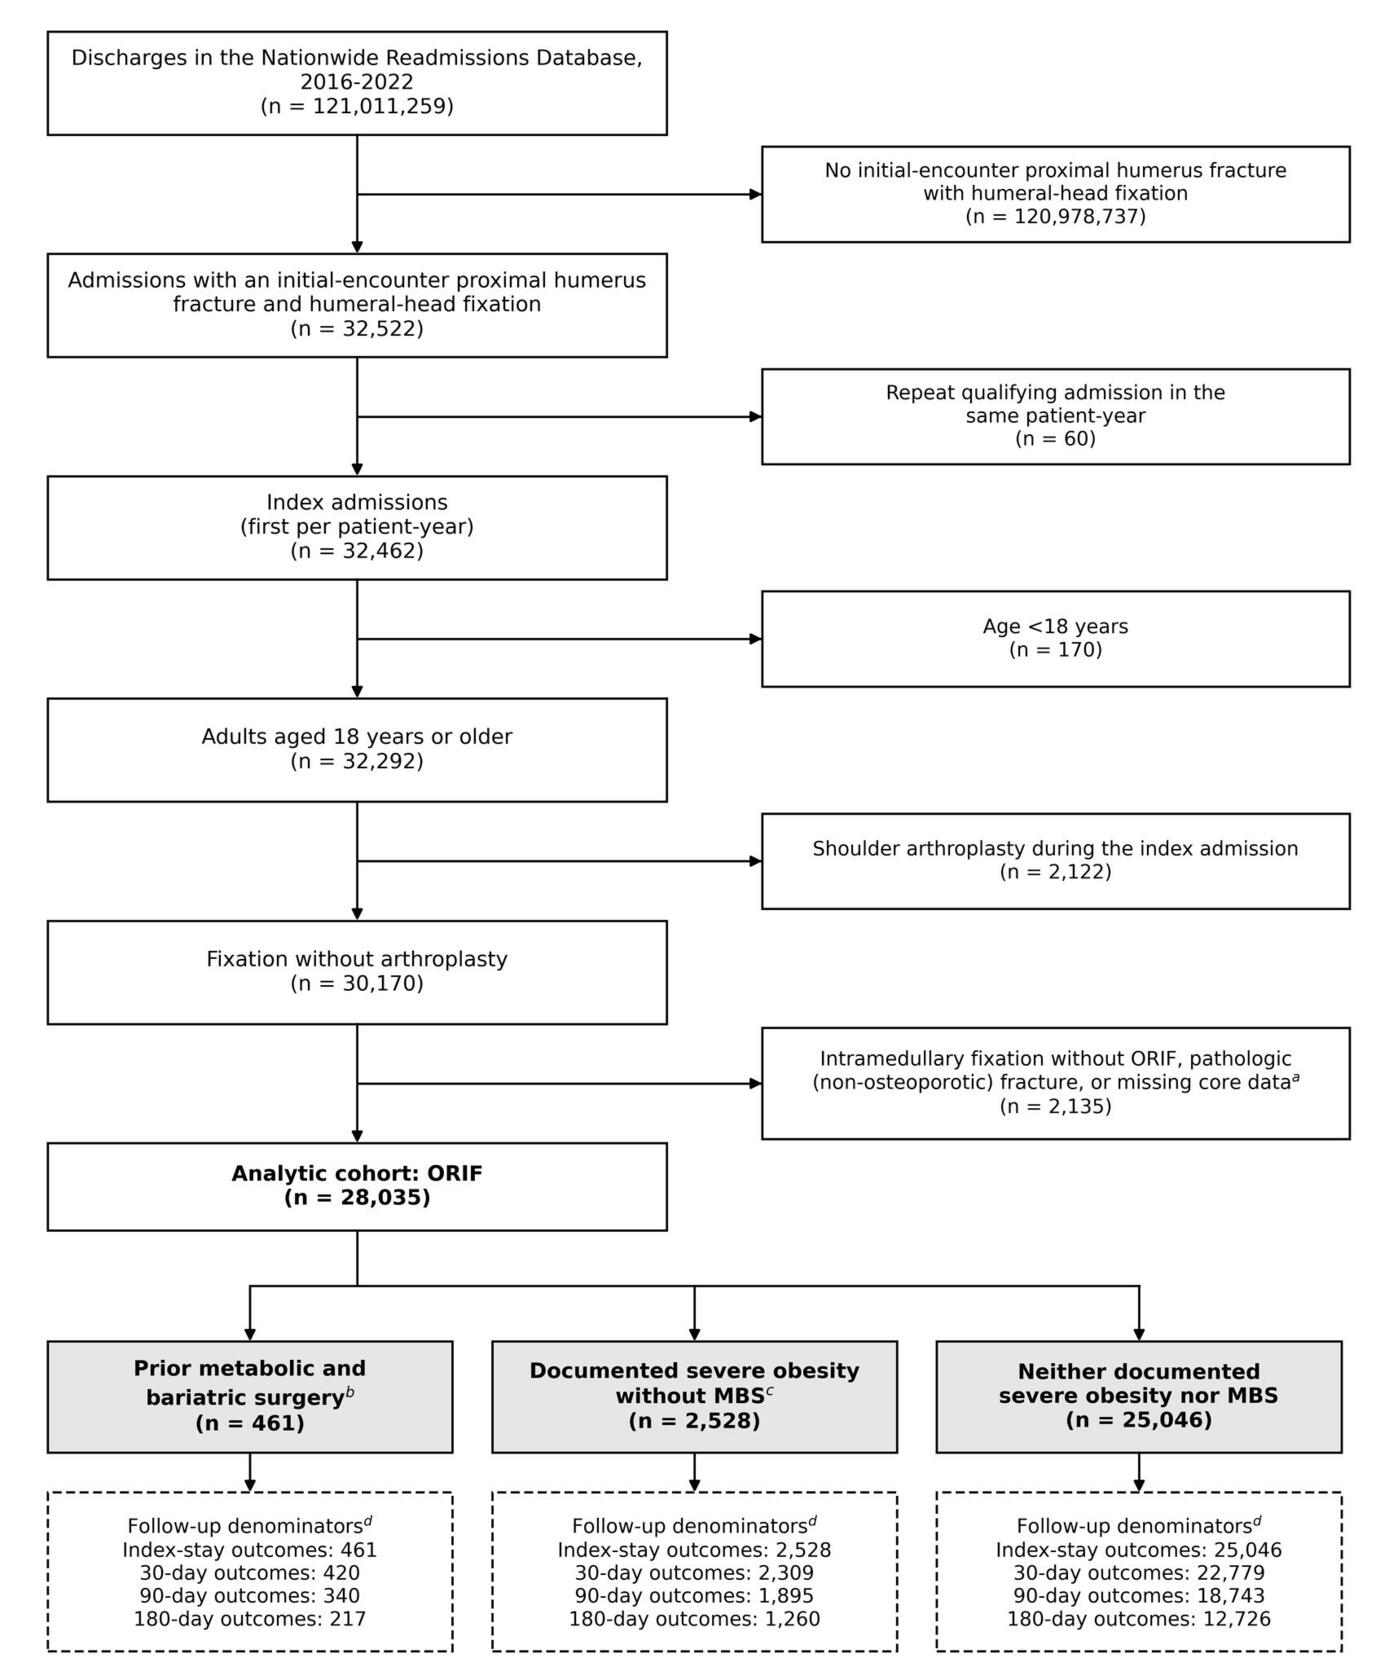
The index hospitalization was the first qualifying admission for each patient within a calendar year. Because NRD patient linkage does not cross calendar years, the same individual could contribute one index hospitalization in more than one study year. Exclusions were age younger than 18 years, shoulder arthroplasty during the index hospitalization, nonosteoporotic pathologic fracture, or missing data required for cohort construction or follow-up (Figure 1). Complete code definitions are provided in eTable 1.
Exposure and Comparison Groups
Prior MBS was identified by International Classification of Diseases, Tenth Revision, Clinical Modification (ICD-10-CM) code Z98.84 for bariatric surgery status or K95 for a complication of a bariatric procedure recorded during the index hospitalization. The primary comparison group included patients without prior MBS who met the study definition of severe obesity based on a qualifying obesity diagnosis (ICD-10-CM E66.01 or E66.2) or BMI of 35 kg/m2 or greater (Z68.35-Z68.45). Patients with neither prior MBS nor severe obesity formed a secondary comparison group. A qualifying obesity diagnosis classified patients as having severe obesity even when a lower BMI category was also recorded. Complete code definitions are provided in eTable 1.
Current body size was evaluated separately from exposure-group assignment. The highest BMI category recorded during the fracture hospitalization was summarized across all three groups, and obesity diagnoses were examined for patients without a BMI code (eTable 2).
To assess how consistently prior MBS was recorded on subsequent hospitalizations, we examined patients with a procedure-documented bariatric operation and determined how often Z98.84 or K95 appeared on later admissions. Because NRD linkage does not cross calendar years, this analysis was limited to later admissions within the same calendar year as the bariatric procedure (eTable 3).
Outcomes and Follow-up
The primary outcome was unplanned all-cause readmission within 30, 90, and 180 days after discharge from the index hospitalization. Unplanned readmissions were identified using the NRD nonelective admission designation.
Secondary outcomes included surgical-site complications, fixation failure, any fracture-specific complication, major medical complications, in-hospital mortality, and non-home discharge. Surgical-site complications included infection, wound dehiscence, device-related infection, and osteomyelitis of the shoulder or upper arm. Fixation failure included mechanical complications of internal fixation, subsequent-encounter nonunion or malunion of the proximal humerus, and same-side reoperation during an unplanned readmission. Same-side reoperation included hardware removal, revision fixation, conversion to arthroplasty, or debridement, with laterality matched to the index procedure. Same-side reoperation is therefore a component of fixation failure and is also reported separately. Any fracture-specific complication was defined as either a surgical-site complication or fixation failure.
Major medical complications were identified using predefined postprocedural diagnosis codes during the index hospitalization or a qualifying medical complication recorded as the principal diagnosis of an unplanned readmission. Because the second component is identified through unplanned readmission, major medical complications overlap with the primary readmission outcome and are not independent of it. Because the NRD does not provide present-on-admission indicators, index-hospitalization events were limited to postprocedural diagnosis code families. Complete definitions are provided in eTable 1. The principal diagnosis of the first unplanned readmission within 90 days was also grouped into clinical categories to characterize reasons for readmission (eTable 4). These broad principal-diagnosis categories were used only to describe reasons for readmission and were not components of the predefined major medical-complication outcome.
In-hospital mortality included death during the index hospitalization or a captured readmission within the specified follow-up window. Deaths occurring outside of the hospital were not captured. Non-home discharge included discharge to another hospital, a skilled nursing facility, or another facility. Records with unknown discharge disposition were classified as not having a non-home discharge. Because NRD linkage does not cross calendar years, complete 30-, 90-, and 180-day follow-up was limited to patients discharged alive by the end of November, September, and June, respectively. These criteria defined the analytic denominator rather than additional cohort exclusions. Because the eligible population therefore differs by window, outcome percentages are not directly comparable across all time windows.
Covariates
The primary adjusted model included age group, sex, primary payer, ZIP-code income quartile, patient residence, calendar year, hospital bed size, teaching status, hospital ownership, open fracture, concurrent fracture, and 14 baseline comorbidities. Age was categorized as 18 to 49, 50 to 64, 65 to 79, and 80 years or older. Comorbidities included diabetes, hypertension, heart failure, coronary artery disease, peripheral vascular disease, chronic pulmonary disease, obstructive sleep apnea, chronic kidney disease, chronic liver disease, dementia, depression, tobacco use, long-term corticosteroid use, and long-term anticoagulation. The supporting all-fixation analysis also adjusted for fixation type.
Protein-calorie malnutrition, micronutrient deficiency, alcohol use disorder, and osteoporosis were excluded from the primary model because they may arise after MBS. They were included in a separate sensitivity model to assess whether additional adjustment changed the estimated associations.
Missing payer values were combined with the other or self-pay category, while missing ZIP-code income and residence values were retained as separate categories. Other variables required for cohort construction were complete or resulted in record exclusion (eTable 5).
Statistical Analysis
Unweighted counts and weighted percentages were reported for descriptive analyses, and standardized mean differences were used to assess baseline differences between groups. Primary analyses incorporated NRD discharge weights and the sampling design, with strata defined by year and NRD stratum and clustering by year and hospital.
Survey-weighted logistic regression was used to estimate unadjusted and adjusted odds ratios with 95% confidence intervals (CIs). For the primary comparison of prior MBS with documented severe obesity without MBS, adjusted absolute risk differences were estimated by standardizing the primary model over patients with prior MBS (that is, comparing predicted risk among patients with prior MBS under each exposure assignment). Outcomes were modeled only when each exposure group contained at least 24 events and 24 nonevents; outcomes below this threshold were reported descriptively. Minimum detectable differences are provided in eTable 6. All eligible discharges were included, and no a priori sample size was specified.
Analyses were performed using Python version 3.12. A two-sided P value less than .05 was considered statistically significant. The 30-, 90-, and 180-day readmission intervals were analyzed separately. These cumulative windows overlap and are therefore correlated. No adjustment for multiple comparisons was applied to secondary or exploratory analyses.
Sensitivity and Supporting Analyses
Thirteen sensitivity analyses evaluated the consistency of the primary findings. These included the broader all-fixation cohort; restriction to admissions with proximal humerus fracture as the principal diagnosis, no concurrent fractures, years other than 2020, or age 18 to 64 years; defining prior MBS using Z98.84 alone; excluding patients with K95 during the fracture hospitalization; using all patients without MBS as the comparator; additional adjustment for protein-calorie malnutrition, micronutrient deficiency, alcohol use disorder, and osteoporosis; inverse probability weighting; overlap weighting; overlap weighting with additional covariate adjustment; and propensity-score matching (eTable 7).
For propensity-based analyses, covariate balance was assessed using standardized mean differences, with an absolute value below 0.10 considered acceptable. Overlap weighting was performed as previously described.24 Matching used 1:3 nearest-neighbor matching without replacement and a caliper of 0.2 standard deviations of the logit of the propensity score.25 The matched analysis used cluster-robust standard errors by hospital and year rather than the primary survey-based variance approach.
Exploratory analyses compared prior-MBS patients with and without documented current severe obesity against patients with documented severe obesity without MBS. Age- and sex-based interaction analyses were performed when event counts permitted. E-values were calculated for the primary associations using the square-root transformation of the odds ratio for common outcomes to assess sensitivity to unmeasured confounding.26
Results
Study Population
The final cohort included 28,035 index hospitalizations for adults undergoing ORIF of a proximal humerus fracture, representing a weighted national estimate of 50,229 index hospitalizations (Figure 1). Of these, 461 had prior MBS, 2,528 had documented severe obesity without MBS, and 25,046 had neither. Complete 30-, 90-, and 180-day follow-up was available for 420, 340, and 217 patients with prior MBS and 2,309, 1,895, and 1,260 with severe obesity, respectively (eTable 8).
Compared with patients with severe obesity, those with prior MBS were younger (mean age, 58.6 vs 60.0 years) and more often female (82.6% vs 71.2%). They had lower rates of diabetes, hypertension, and obstructive sleep apnea and higher rates of depression, alcohol use disorder, osteoporosis, micronutrient deficiency, and protein-calorie malnutrition (Table 1). Alcohol use disorder was present in 14.9% versus 5.1%, osteoporosis in 13.1% versus 6.7%, micronutrient deficiency in 13.8% versus 8.7%, and protein-calorie malnutrition in 4.2% versus 1.4%. Missing data were uncommon (eTable 5).
A BMI code was recorded for 32.3% of patients with prior MBS. Among those with a recorded BMI, at least 59% had a BMI of 35 kg/m2 or greater, and 109 of 461 patients with prior MBS had a documented current severe-obesity code. BMI or obesity codes were available for nearly all patients in the severe-obesity group because these codes contributed to its definition (eTable 2).
Unplanned Readmission
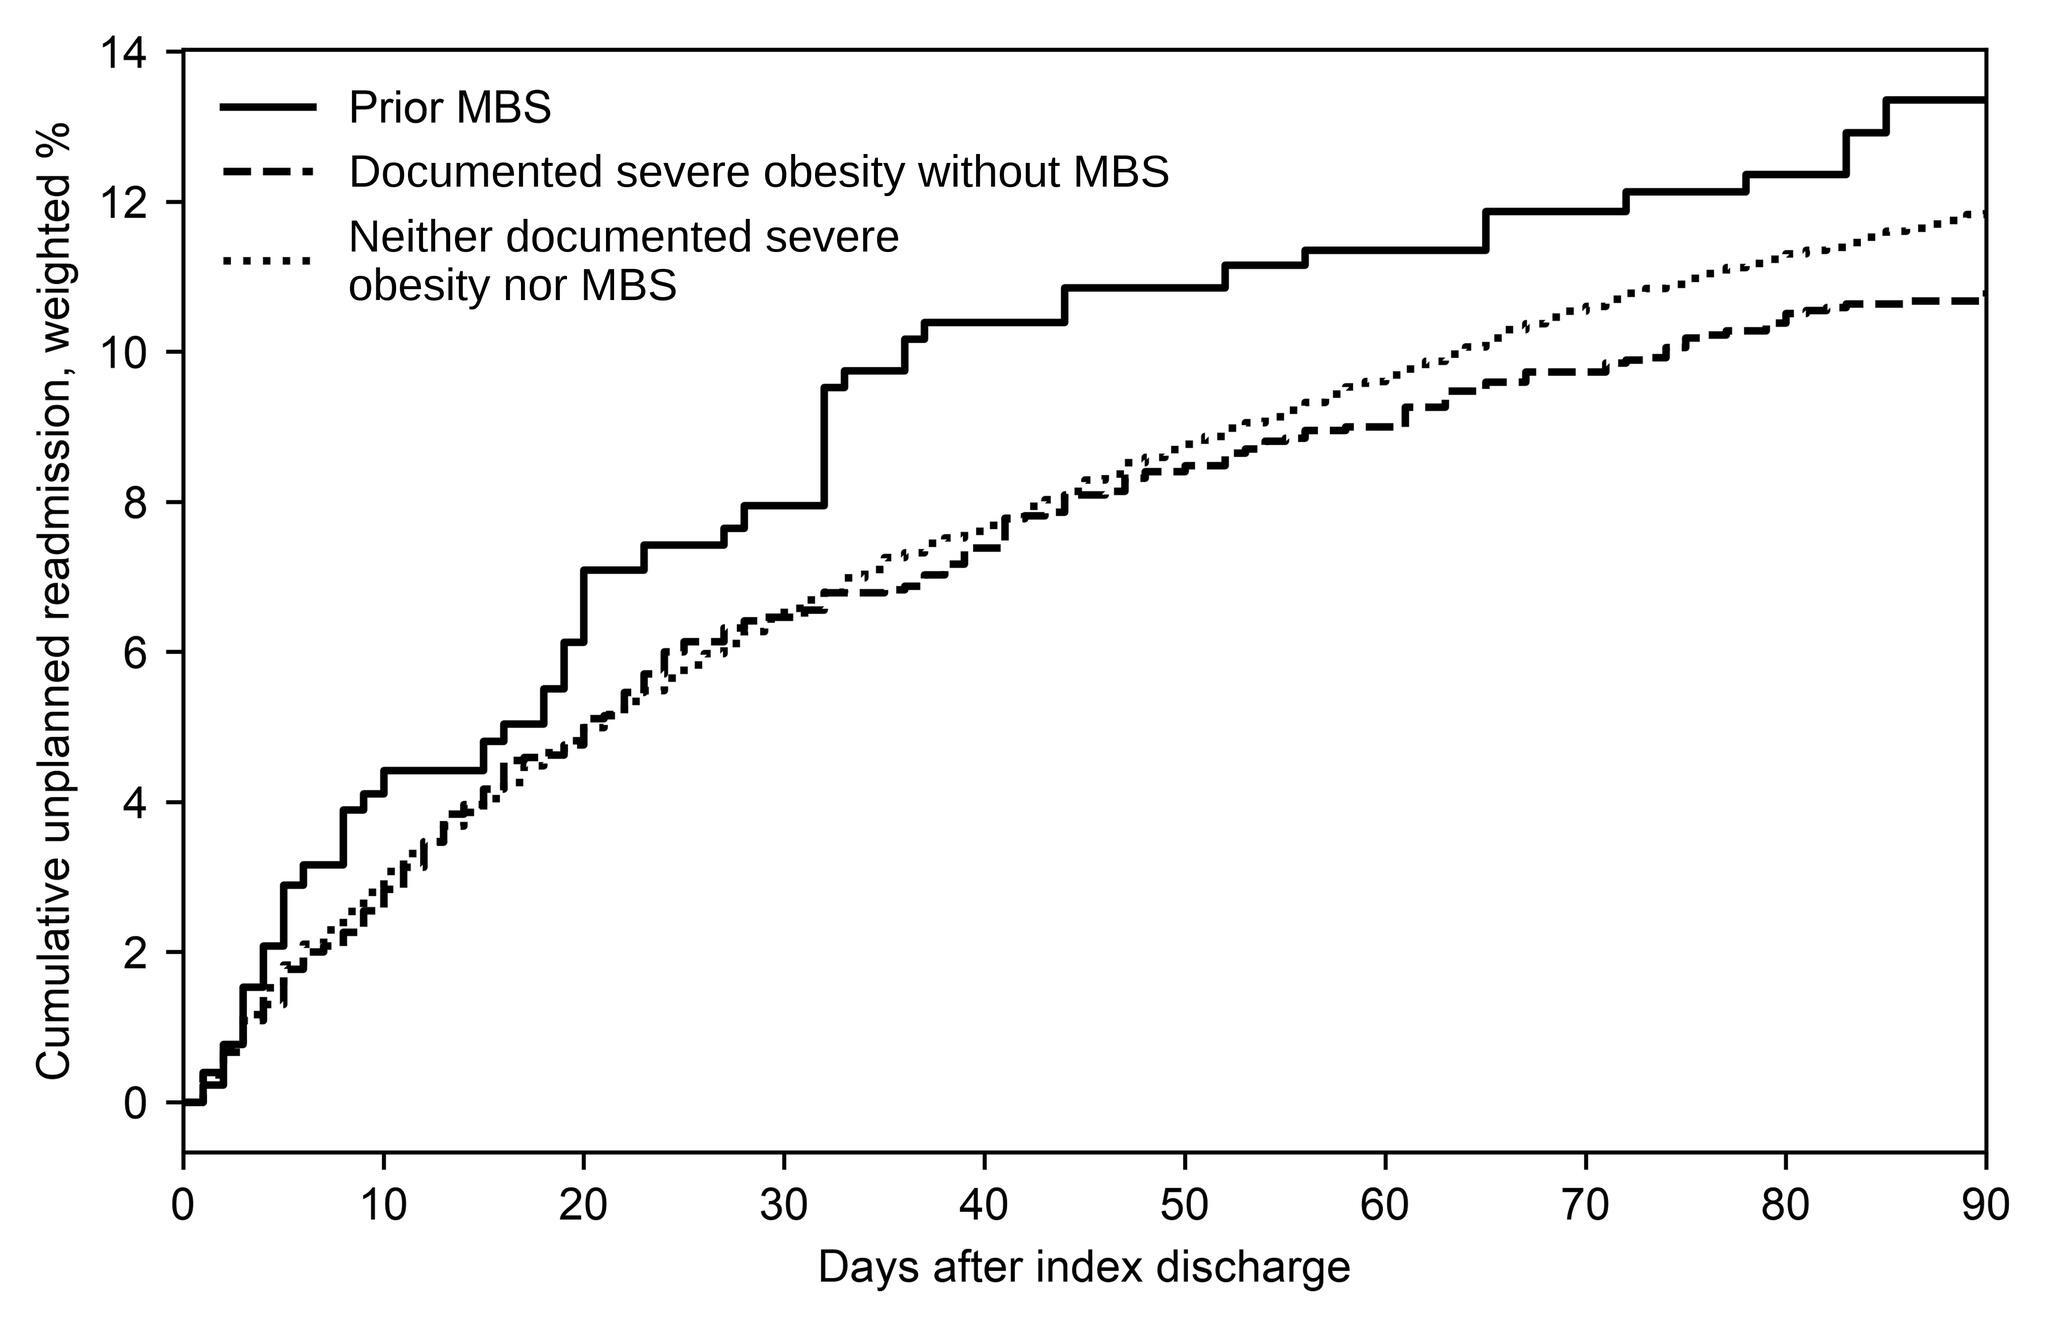
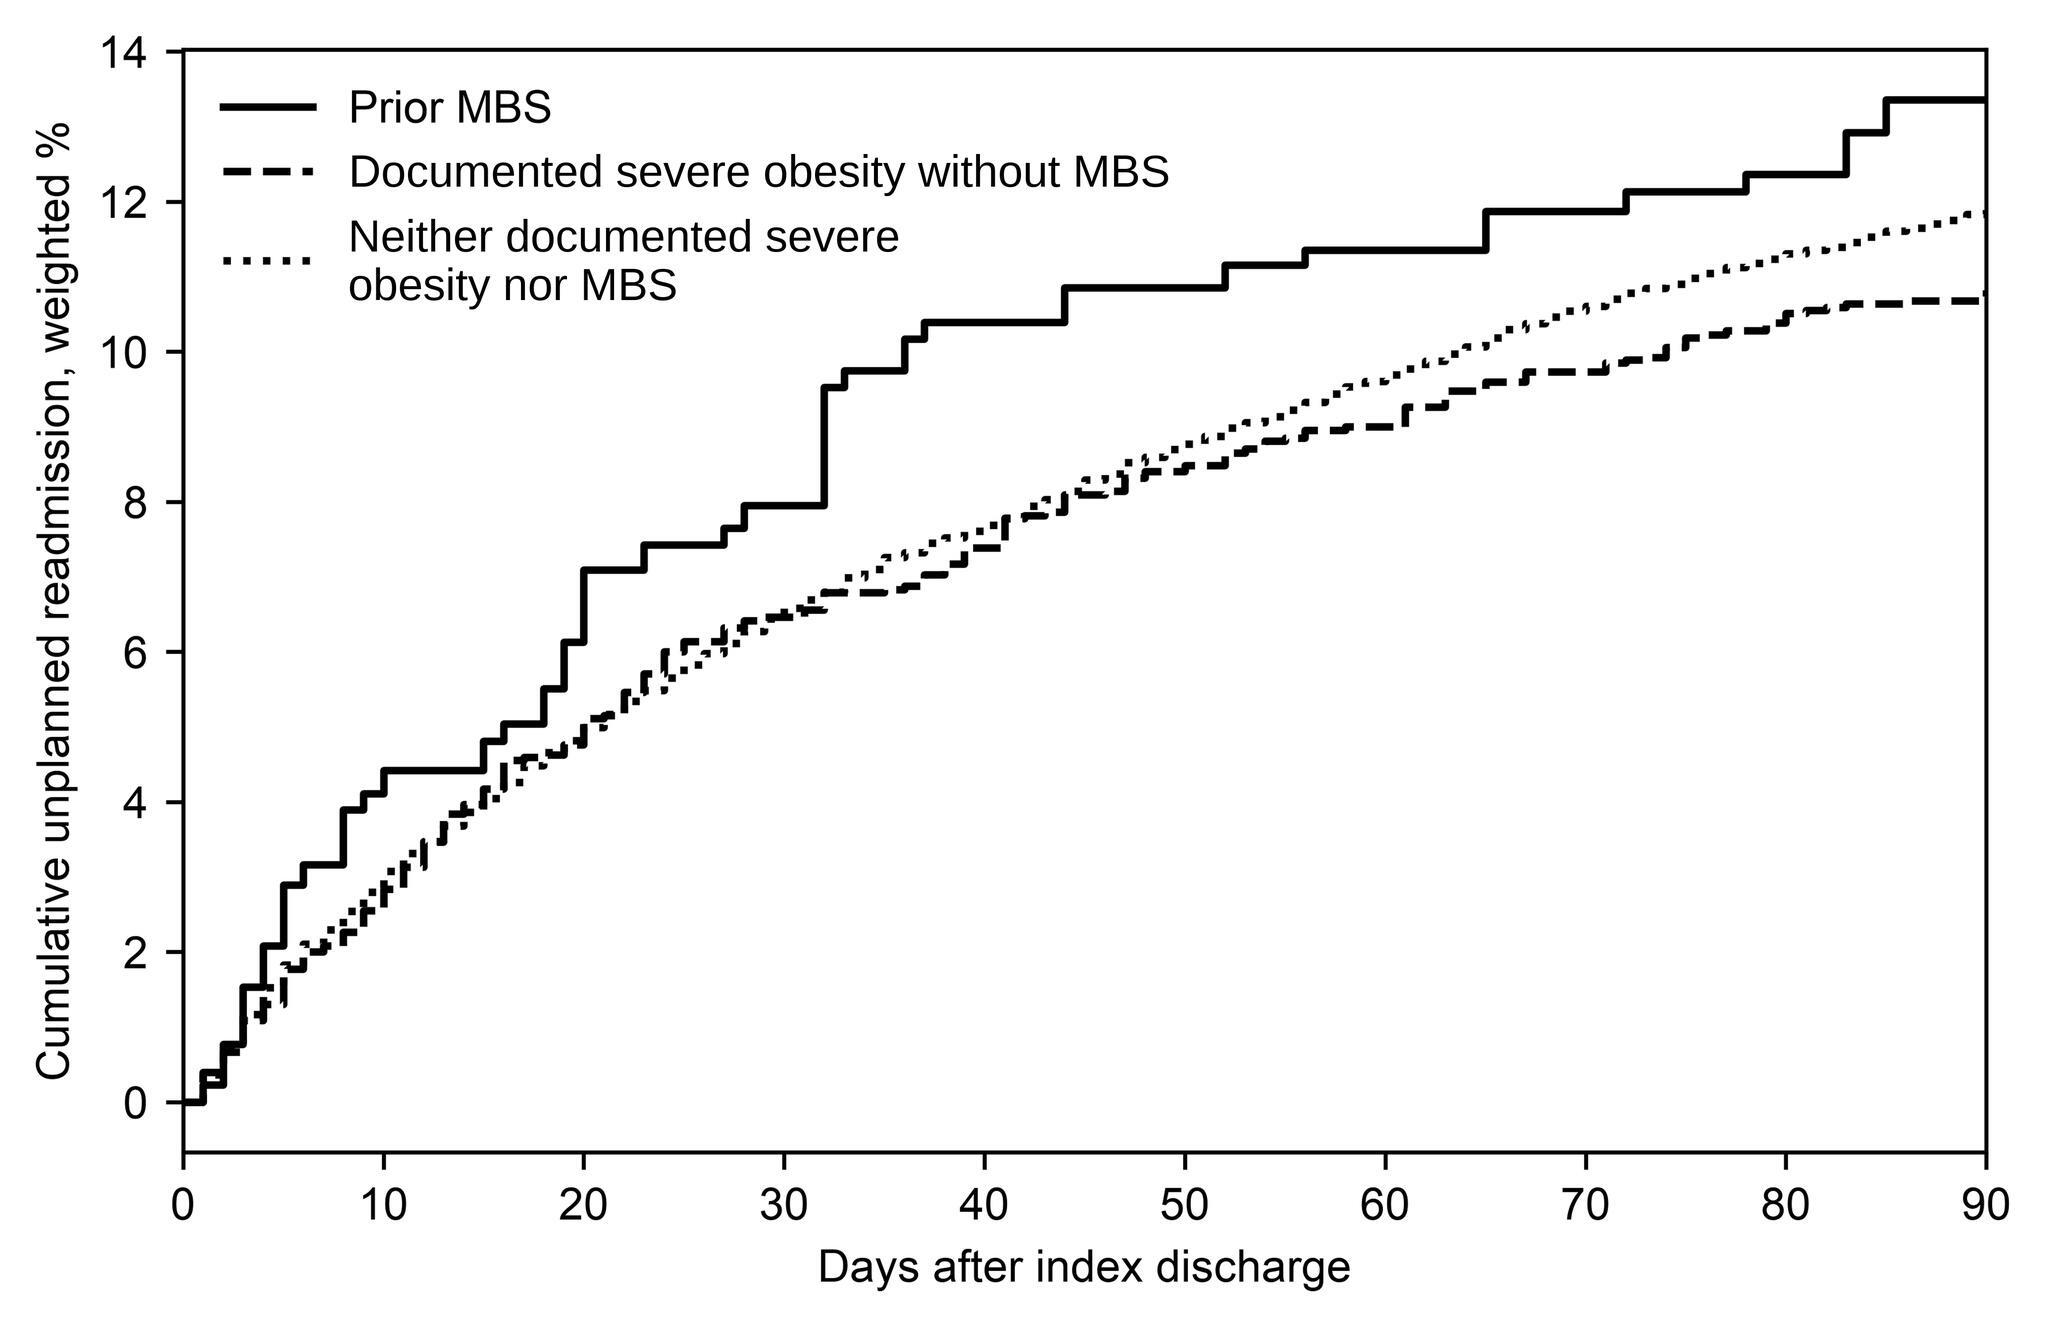
Unplanned readmission occurred in 7.5% of patients with prior MBS and 6.6% of patients with severe obesity at 30 days, 13.4% and 10.8% at 90 days, and 20.3% and 15.3% at 180 days, respectively (Table 2).
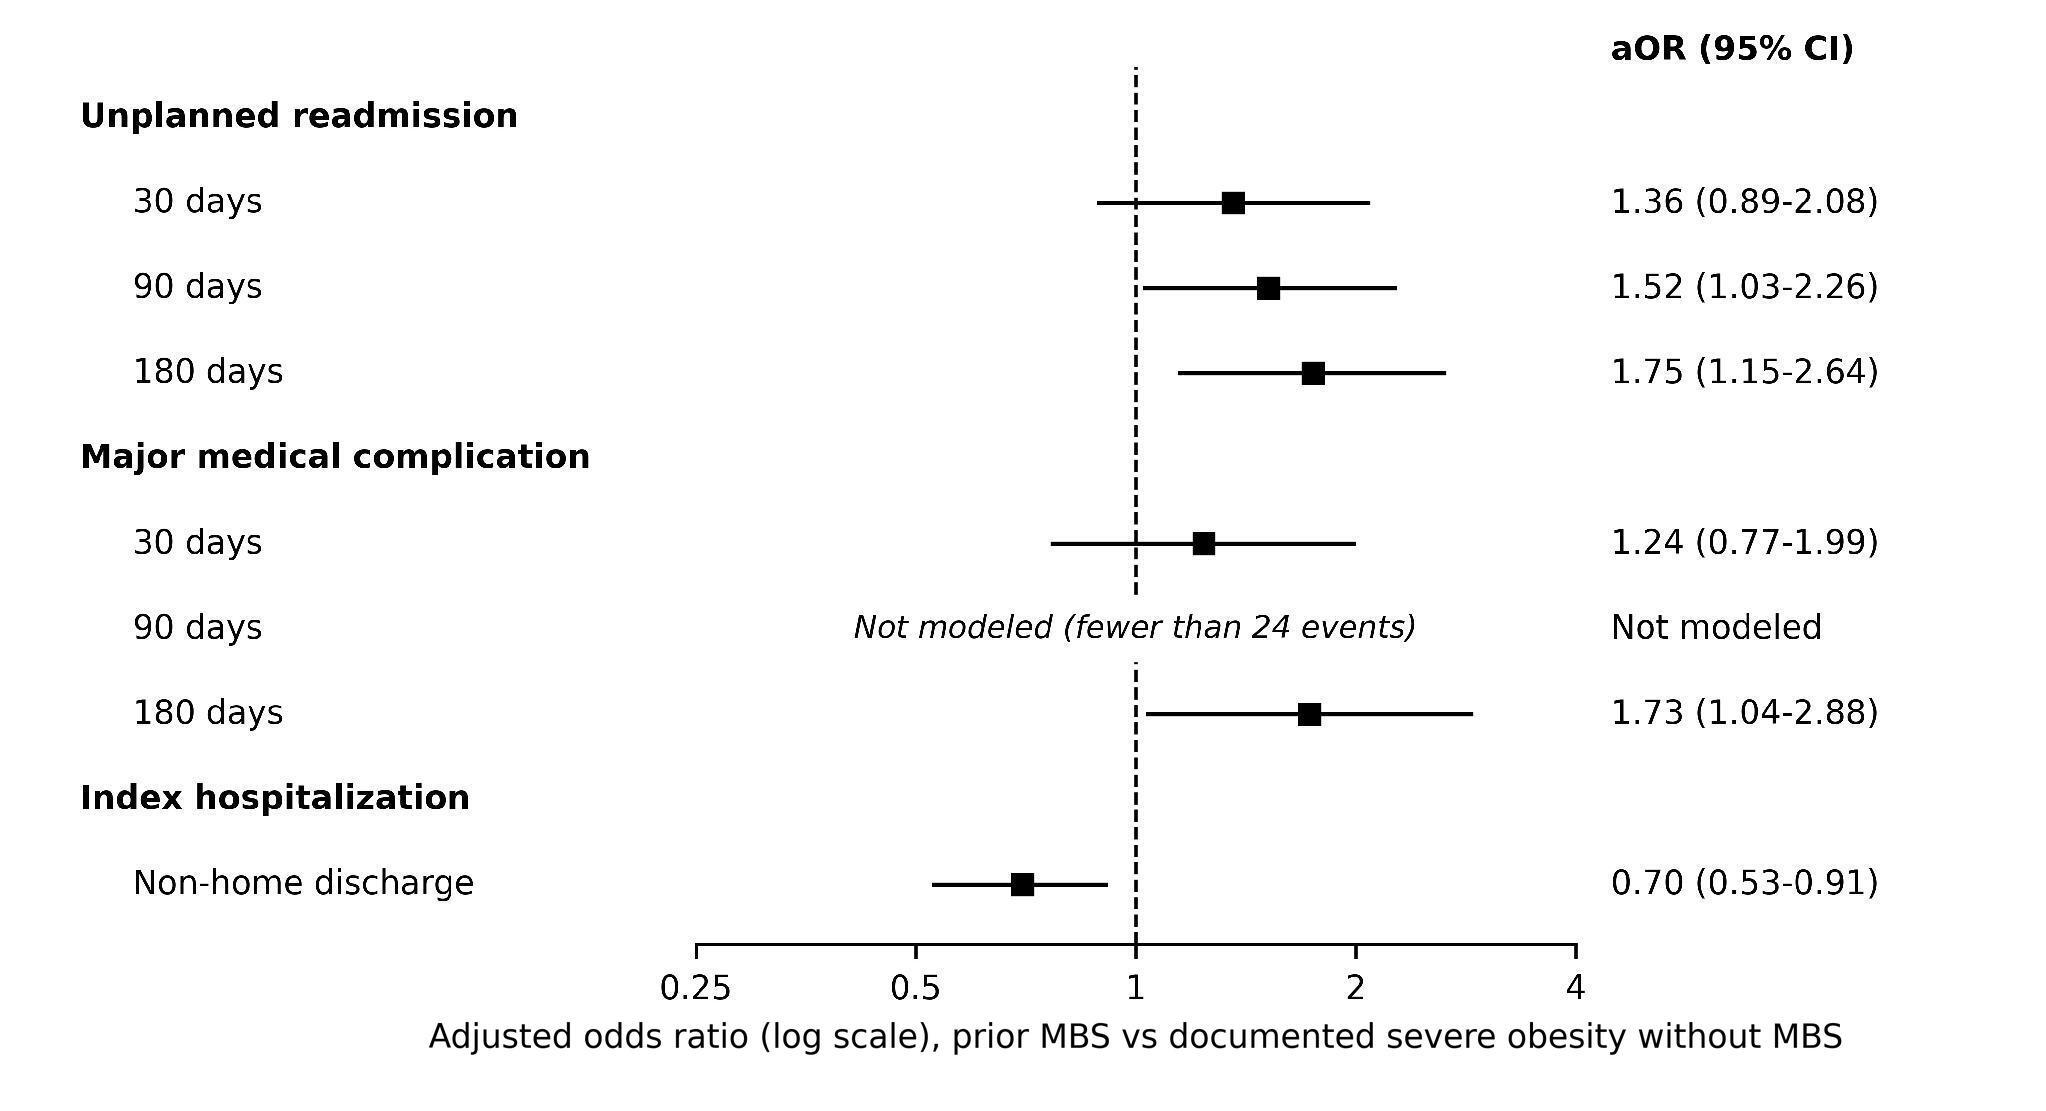
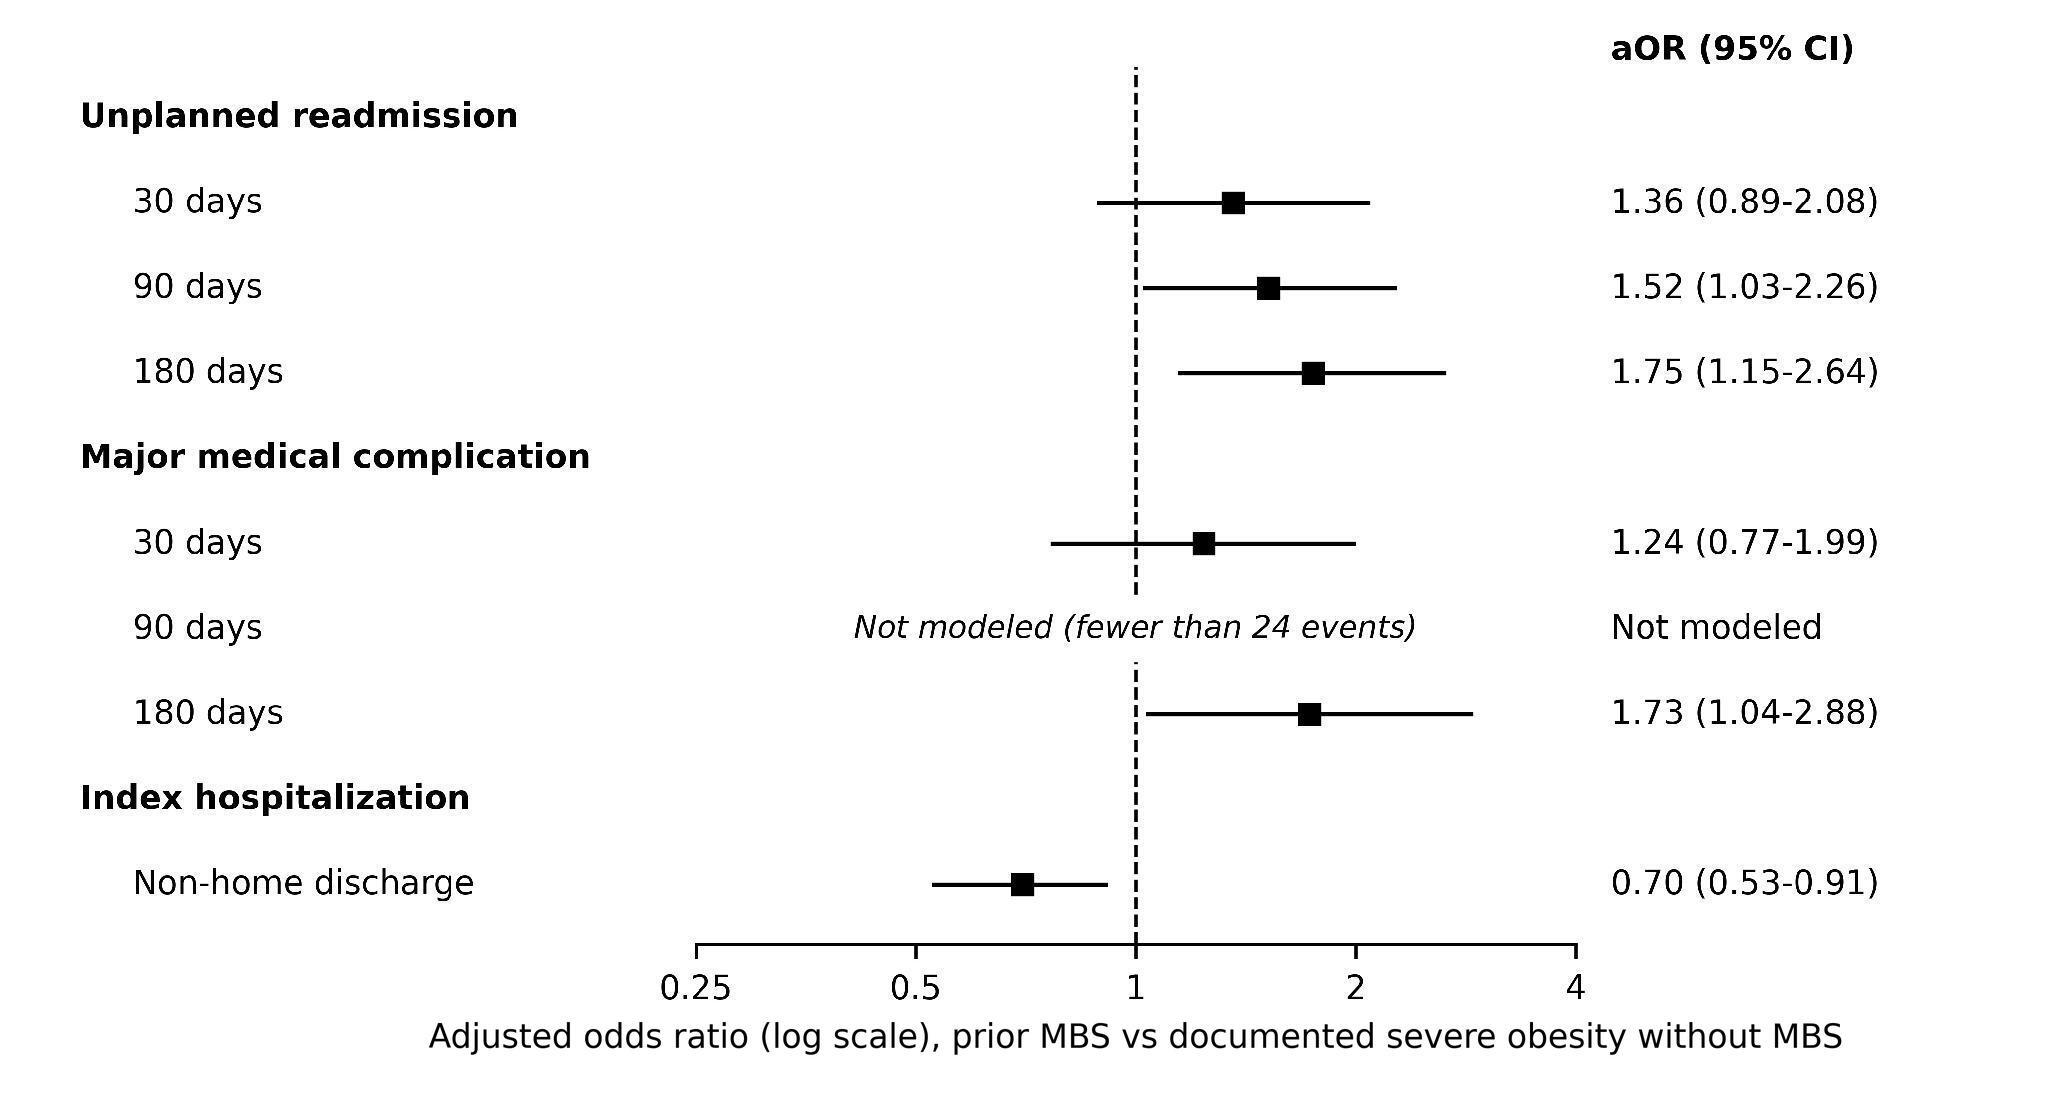
After adjustment, prior MBS was associated with higher odds of readmission at 90 days (adjusted odds ratio [aOR], 1.52; 95% CI, 1.03-2.26) and 180 days (aOR, 1.75; 95% CI, 1.15-2.64) (Figure 2). The adjusted absolute differences were 4.0 percentage points at 90 days (95% CI, -0.1 to 8.1) and 7.1 percentage points at 180 days (95% CI, 1.2-13.0) (eTable 9). The 30-day association was not statistically significant (aOR, 1.36; 95% CI, 0.89-2.08). Cumulative readmission through 90 days is shown in Figure 3. At 180 days, readmission did not differ detectably between patients with severe obesity and those with neither documented severe obesity nor prior MBS (aOR, 0.87; 95% CI, 0.72-1.05).
Among first unplanned readmissions within 90 days, gastrointestinal, nutritional, or metabolic diagnoses accounted for 13 readmissions in patients with prior MBS, representing a weighted proportion of 25.9%. These diagnoses accounted for 6.8% of first readmissions among patients with severe obesity and 10.7% among patients with neither condition (eTable 4).
Medical Complications
At 180 days, major medical complications occurred in 12.7% of patients with prior MBS and 9.5% of patients with severe obesity. Prior MBS was associated with higher adjusted odds of a medical complication (aOR, 1.73; 95% CI, 1.04-2.88), with an adjusted absolute difference of 4.8 percentage points (95% CI, -0.3 to 9.9) (Figure 2; eTable 9). At 30 days, the association was not statistically significant (aOR, 1.24; 95% CI, 0.77-1.99). Event counts were insufficient for adjusted modeling at 90 days.
Fracture-Specific Outcomes
Fracture-specific complications were uncommon in both groups. Among patients with severe obesity, surgical-site complications occurred in 1.9% to 2.4%, fixation failure in 1.3% to 2.8%, and same-side reoperation in 0.6% to 0.9% across follow-up intervals. Among patients with prior MBS, most individual fracture-specific outcomes occurred in fewer than 11 patients (Table 2).
At 90 days, fixation failure occurred in 3.9% of patients with prior MBS and 2.0% of patients with severe obesity, for a risk difference of 2.0 percentage points (95% CI, -0.6 to 4.5). At 180 days, any fracture-specific complication occurred in 6.4% and 4.7%, respectively, for a risk difference of 1.7 percentage points (95% CI, -2.3 to 5.7). Event counts were insufficient for adjusted modeling, and minimum detectable odds ratios ranged from approximately 1.9 to 2.4 (eTable 6).
Index Hospitalization
Median length of stay was 3 days (interquartile range [IQR], 2-6) among patients with prior MBS and 4 days (IQR, 2-7) among patients with severe obesity. Non-home discharge was less common in the prior-MBS group (22.3% vs 33.2%) and remained lower after adjustment (aOR, 0.70; 95% CI, 0.53-0.91), with an adjusted absolute difference of -5.8 percentage points (95% CI, -9.9 to -1.8) (Figure 2). In-hospital mortality was uncommon, with fewer than 11 deaths among patients with prior MBS in each follow-up window.
Sensitivity and Supporting Analyses
The association between prior MBS and 180-day readmission remained above 1 across all 13 sensitivity analyses, with odds ratios (ORs) ranging from 1.53 to 2.12 and 95% CIs excluding 1 in each analysis (eTable 7). Estimates were similar in the all-fixation cohort (aOR, 1.64; 95% CI, 1.10-2.45; eTable 10), when PHF was restricted to the principal diagnosis (aOR, 1.87; 95% CI, 1.17-2.99), and among patients aged 18 to 64 years (aOR, 2.12; 95% CI, 1.26-3.57). The Z98.84-only analysis was identical to the primary analysis, which implies that every patient with K95 also had Z98.84, and excluding patients with K95 produced a similar estimate (aOR, 1.76; 95% CI, 1.16-2.66).
Propensity-based estimates for 180-day readmission were 1.53 (95% CI, 1.01-2.31) with overlap weighting, 1.89 (95% CI, 1.23-2.90) with overlap weighting and additional covariate adjustment, and 1.59 (95% CI, 1.05-2.41) after matching. At 90 days, estimates ranged from 1.37 to 1.45, with all 95% CIs including 1 (eTables 7 and 11-13; eFigure 1). Matching included 420 of 461 patients with prior MBS and achieved standardized mean differences below 0.10 for all measured covariates.
For 180-day medical complications, ORs ranged from 1.57 to 1.90 among estimable analyses retaining documented severe obesity without MBS as the comparator. The analysis using all patients without MBS yielded an OR of 2.28 (95% CI, 1.43-3.62), and several sensitivity CIs included 1. Additional adjustment for protein-calorie malnutrition, micronutrient deficiency, alcohol use disorder, and osteoporosis yielded aORs of 1.62 (95% CI, 1.08-2.43) for readmission and 1.66 (95% CI, 0.99-2.77) for medical complications (eTable 14).
Among patients with prior MBS without a documented current severe-obesity code, readmission remained higher at 90 days (aOR, 1.67; 95% CI, 1.09-2.54) and 180 days (aOR, 2.03; 95% CI, 1.29-3.20). However, 295 of 352 patients in this subgroup had no BMI or obesity code recorded, limiting interpretation of current body size. Event counts were insufficient among the 109 patients with prior MBS and documented current severe obesity (eTable 15). Age- and sex-based interaction analyses could not be estimated for readmission or medical complications because of insufficient events (eTable 16). Among patients with a procedure-documented bariatric operation, Z98.84 or K95 was recorded on 74.1% of later same-year admissions and 54.8% of orthopedic admissions (eTable 3).
Discussion
In this nationwide cohort of adults undergoing inpatient ORIF of a proximal humerus fracture, prior MBS was associated with higher unplanned readmission compared with documented severe obesity without MBS. The association was strongest and most consistent at 180 days and remained present across all sensitivity analyses. The 90-day association was less consistent across propensity-based analyses, and the 180-day medical-complication association was not significant in every sensitivity analysis. Fracture-specific complications were uncommon, and the study did not detect a clear between-group difference.
The reasons for readmission provide clinical context for this finding. Gastrointestinal, nutritional, or metabolic diagnoses accounted for 25.9% of first unplanned readmissions within 90 days among patients with prior MBS compared with 6.8% among patients with severe obesity. This represented 13 readmissions in the prior-MBS group, so these proportions should be interpreted cautiously. Patients who have undergone MBS remain at risk for long-term protein and micronutrient deficiencies and other nutritional complications, and current guidance emphasizes ongoing nutritional assessment.14,15,27 Alcohol use disorder was also more common at baseline in the prior-MBS group, consistent with prior literature describing increased alcohol-related problems after some bariatric procedures.16,28 Both alcohol use disorder and protein-calorie malnutrition, however, were more common in the prior-MBS group than in the severe-obesity group but at similar levels to the group with neither condition (Table 1), so these contrasts partly reflect their low prevalence in the comparator. These factors may help identify relevant clinical concerns but do not establish the cause of individual readmissions.
The severe-obesity group provided a clinically relevant comparator, but the observed association cannot be assumed to be independent of current body size. BMI documentation was incomplete among patients with prior MBS, and most patients without a documented current severe-obesity code also lacked any BMI or obesity code during the fracture hospitalization. The secondary comparison group similarly represented the absence of documented severe obesity rather than confirmed absence of obesity. In addition, the severe-obesity group had readmission rates similar to or lower than the group with neither condition (Table 2), so the choice of comparator may influence the magnitude of the observed association.
MBS has been associated with altered calcium and vitamin D metabolism, increased bone turnover, lower bone mineral density, and increased fracture risk.10–13,29 Despite these concerns, we did not detect a clear increase in fracture-specific complications after ORIF. This finding should not be interpreted as evidence that fracture healing is unaffected by prior MBS. Fracture-specific events were uncommon, most adjusted models could not be fit, and only relatively large differences could be detected. In addition, planned revision procedures, hardware removal, and procedures performed outside an unplanned inpatient readmission were not captured.
These findings extend prior orthopedic literature on patients with a history of bariatric surgery. Marigi et al reported higher overall and surgical complication rates after primary shoulder arthroplasty among patients with prior bariatric surgery, while reoperation and revision rates did not differ overall.17 Studies in spine surgery and lower-extremity arthroplasty have reported mixed findings.18–21 In the present study, unplanned readmission was the most consistent adverse outcome, whereas a clear increase in fracture-specific complications was not detected. Patients with prior MBS were also less often discharged to a facility and had a shorter median length of stay; the reasons for this were not able to be examined, and discharge disposition, which follows the exposure, was not included in the adjusted models but could influence postdischarge readmission risk.
For orthopedic surgeons, the adjusted 7.1-percentage-point difference in 180-day readmission provides a clinically interpretable measure of the association. A history of MBS may identify patients who warrant closer review of nutritional history, known deficiencies, gastrointestinal or metabolic concerns, and coordination with primary care or bariatric teams when clinically indicated. Bariatric history was also incompletely recorded on subsequent hospitalizations, supporting the value of obtaining this history directly rather than relying on encounter coding alone.
The 180-day readmission association remained above 1 with 95% CIs excluding 1 across all 13 sensitivity analyses, reducing concern that the finding depended on a single cohort definition or analytic approach. These analyses do not eliminate residual confounding. The E-value for 180-day readmission was 1.97 for the point estimate and 1.36 for the CI limit (eTable 14), supporting continued caution when interpreting the magnitude of the association. Future studies with more complete information on bariatric procedure type and timing, current body size, nutritional status, and longitudinal clinical outcomes are needed.
Limitations
This study has several limitations. First, prior MBS was identified using diagnosis codes rather than longitudinal procedural history. In the supporting validation analysis, Z98.84 or K95 was recorded on 74.1% of later same-year admissions after a procedure-documented bariatric operation and 54.8% of orthopedic admissions, indicating incomplete capture of bariatric history. Because this check was limited to admissions within the same calendar year as the bariatric procedure, capture may be lower for remote operations, and nondifferential misclassification of prior MBS into the comparison groups would generally be expected to bias estimates towards the null. Bariatric procedure type and time since surgery were unavailable.
Second, current body size was incompletely documented. BMI was available for only approximately one-third of patients with prior MBS, and the secondary comparison group represented the absence of documented severe obesity rather than confirmed absence of obesity. The study therefore cannot determine whether the observed association is independent of current body size.
Third, the NRD lacks present-on-admission indicators and detailed clinical information. Postprocedural diagnosis codes may not always distinguish new perioperative events from preexisting postprocedural conditions. Fracture classification, reduction quality, radiographic healing, bone mineral density, and nutritional laboratory values were unavailable. The procedure codes identify open reduction and internal fixation but do not specify the exact implant construct.
Fourth, follow-up was limited to the same state and calendar year. Because NRD linkage resets each calendar year, the same person could contribute more than one index hospitalization across the study period. Only 50.7% of the cohort was eligible for complete 180-day follow-up, and out-of-state readmissions were not captured. The study was also limited to inpatient fixation. Planned revision procedures, outpatient procedures, emergency department visits without admission, and other events managed outside an unplanned inpatient readmission were not captured.
Finally, residual confounding and coding misclassification remain possible. Secondary and exploratory analyses were not adjusted for multiple comparisons, and limited event counts reduced precision for fracture-specific and subgroup analyses. The number of events in the prior-MBS group was also small relative to the number of covariates in the primary model, so adjusted estimates may be unstable; the propensity-based sensitivity analyses provide a partial check. These findings represent associations and do not establish causation.
Conclusion
Among adults undergoing inpatient ORIF of a proximal humerus fracture, prior MBS was associated with higher unplanned readmission compared with documented severe obesity without MBS, with the most consistent difference observed at 180 days. The study did not detect a clear difference in fracture-specific complications, although limited event counts precluded precise comparisons. Bariatric history may prompt review of known nutritional or metabolic concerns and established postdischarge follow-up.
Acknowledgments
None.
Author contributions
Madeline Wethington, Spencer Comfort, MiKinze Boeder, Fatumastar Adan, and Jonathan Harley contributed to data curation, manuscript preparation and drafting, review and editing, and manuscript revision. Zachary Leslie performed the statistical analyses and contributed to data interpretation, table and figure development, manuscript formatting, and review and editing. Alicia Harrison and Allison Rao conceived the study, provided clinical and methodological oversight, supervised the project, and critically reviewed and revised the manuscript. Allison Rao also contributed to manuscript drafting and development.
Conflicts of interest
Madeline Wethington reports no conflicts of interest. Spencer Comfort reports no conflicts of interest. MiKinze Boeder reports no conflicts of interest. Fatumastar Adan reports no conflicts of interest. Jonathan Harley reports no conflicts of interest. Zachary Leslie reports no conflicts of interest. Alicia Harrison reports a consulting relationship with Arthrex, Inc. Allison Rao reports a consulting relationship with Arthrex, Inc.
Funding
This study received no external funding; there was no funder role in its design, analysis, interpretation, or the decision to submit.
Conference presentation
None.
Other disclosures
Zachary Leslie is a data analyst at Milliman. This research was conducted independently of Milliman, which did not fund or endorse it.